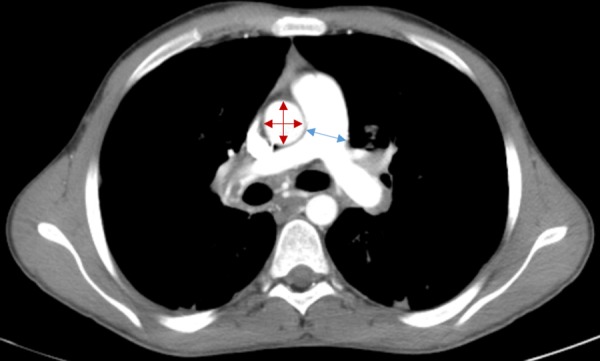
Fig 1. Pulmonary arterial enlargement in severe cystic fibrosis.

A representative axial image of a CT scan at the level of the pulmonary artery (PA) bifurcation. The diameter of the PA is measured at the location indicated by the blue arrow. The diameter of the ascending aorta (A) is calculated using two perpendicular measurements indicated by the red arrows. PA enlargement (PA:A>1) is present in this image.
