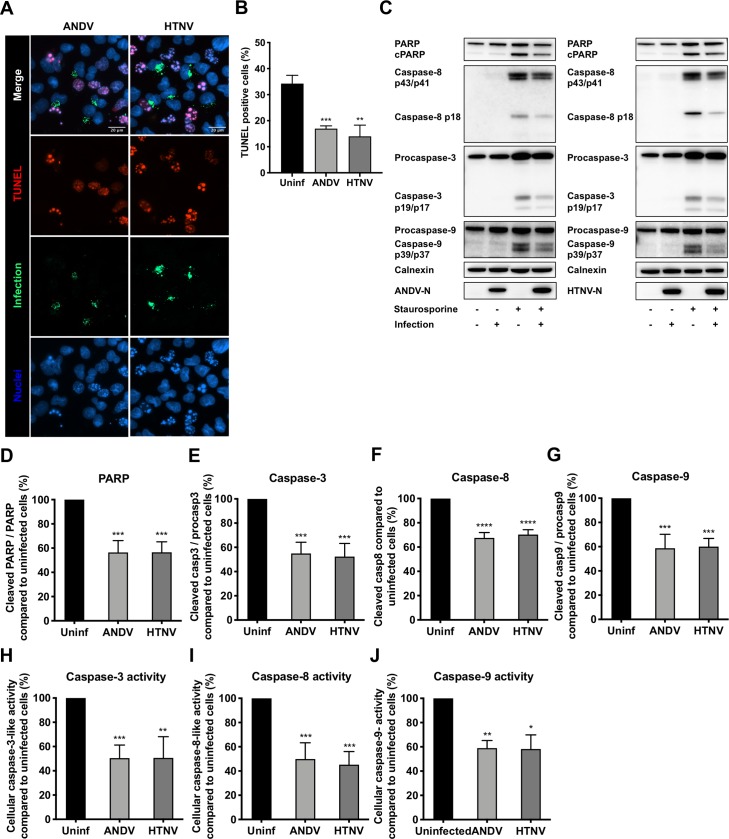
Fig 1. Hantavirus infection hampers the activation of caspases in staurosporine-exposed A549 cells.
A549 cells were infected at a multiplicity of infection (MOI) of 1 in order to achieve ≥90% infection rates at 72 hours post-infection (see S1 Fig), when cells were treated with 2 μM of STS for 4 hours. For TUNEL analysis only, cells were infected at a lower MOI of 0.01 to achieve around 30% infection rates at 72 hours post-infection when cells were exposed to STS. (A) Representative immunofluorescence staining of ANDV-infected, HTNV-infected and uninfected cells after STS-treatment. TUNEL (red) was used to label apoptotic cells and polyclonal antibodies from convalescent patient serum (green) to detect ANDV- and HTNV-infected cells. DAPI (blue) was used for nuclear counterstaining. One representative experiment out of three independent experiments is shown. Scale bar, 20 μm. (B) Percentages of TUNEL positive cells after STS-treatment. Numbers of TUNEL-positive infected and uninfected cells on the same slides were determined using fluorescence microscopy. Data shown represent the mean ± SD from three independent experiments in which at least 300 cells were counted for each experiment. (C) Representative western blot of cleaved PARP, caspase-8, caspase-9 and caspase-3 from lysates of ANDV-infected, HTNV-infected and uninfected A549 cells after STS- treatment. ANDV and HTNV nucleocapsid protein (ANDV-N; HTNV-N) were detected using the monoclonal antibody 1C12. Calnexin was used as loading control. One representative experiment out of three independent experiments is shown. (D-G) Analysis of cleaved PARP (D), caspase-3 (E), caspase-8 (F) and caspase-9 (G) by band densitometry. Ratios between cleaved PARP and full-length PARP, between caspase-3 and procaspase-3, and between caspase-9 and procaspase-9, were respectively calculated and compared between infected and uninfected cells after STS-treatment. The amount of caspase-8 in infected cells was calculated and compared to that in uninfected cells after STS-treatment. STS-treated uninfected cells represent maximal PARP, procaspase-8, procaspase-3 or procaspase-9 cleavage at 4 hours after STS-treatment. Calnexin was used as loading control and band densitometry analysis was done using ImageJ. Data shown represent the mean ± SD from three independent experiments. (H) Graph displaying caspase-3 activity in hantavirus infected and uninfected cells after STS-treatment. Caspase-3 activity in uninfected cells represents maximal caspase-3 activity. Data shown represent the mean ± SD from three independent experiments. (I) Graph displaying caspase-8 activity in hantavirus infected and uninfected cells after STS-treatment. Caspase-8 activity in uninfected cells represents maximal caspase-8 activity. Data shown represent the mean ± SD from three independent experiments. (J) Graph displaying caspase-9 activity in hantavirus infected and uninfected cells after STS-treatment. Caspase-9 activity in uninfected cells represents maximal caspase-9 activity. Data shown represent the mean ± SD from three independent experiments. Paired t test was used for statistical evaluation: **** p<0.0001, *** p<0.001, ** p<0.01, * p<0.05.

