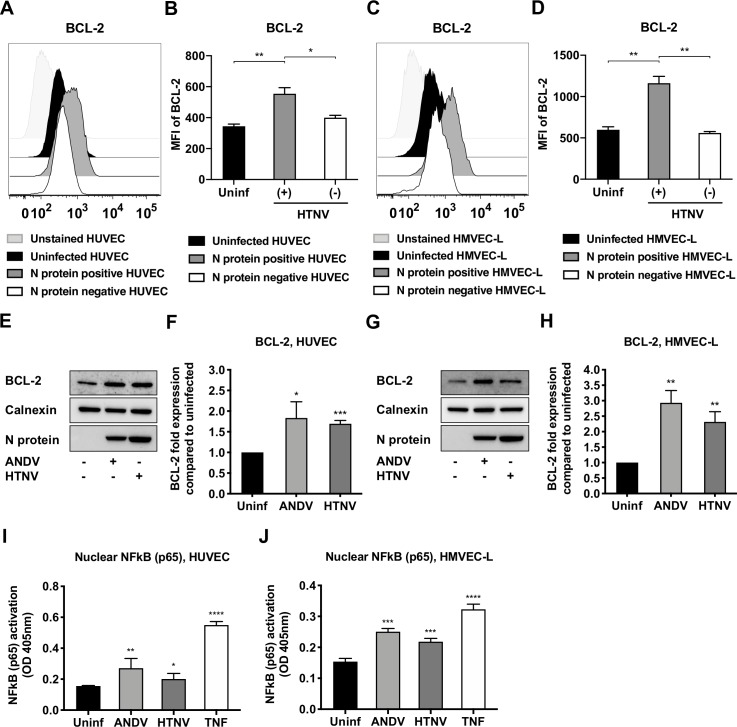
Fig 7. The expression of the pro-survival factor BCL-2 is increased in hantavirus-infected endothelial cells.
HUVECs and HMVECs were infected with ANDV or HTNV at MOI 1. At 72 hours p.i. the expression of the anti-apoptotic BCL-2 and the nuclear translocation of NFkB were determined. (A) Representative histogram of flow cytometry analysis of BCL-2 expression in infected (N-protein+) and uninfected (N-protein-) cells within the HTNV-exposed HUVECs condition, as well as in uninfected HUVECs. One representative experiment out of three independent experiments is shown. (B) Flow cytometry analysis of BCL-2 expression in HUVECs shown as mean fluorescence intensity (MFI) after gating on N-protein+ and N-protein- cells within the HTNV-infected cells condition, as well as on uninfected cells. Data shown represent the mean ± SD from three independent experiments. (C) Representative histogram of flow cytometry analysis of BCL-2 expression in infected (N-protein+) and uninfected (N-protein-) cells within the HTNV-exposed HMVECs condition, as well as in uninfected HMVECs. One representative experiment out of three independent experiments is shown. (D) Flow cytometry analysis of BCL-2 expression in HMVECs shown as mean fluorescence intensity (MFI) after gating on N-protein+ and N-protein- cells within the HTNV-infected cells condition, as well as on uninfected cells. Data shown represent the mean ± SD from three independent experiments. (E) Representative western blot of BCL-2 from lysates of ANDV-infected, HTNV-infected and uninfected HUVECs. ANDV and HTNV nucleocapsid protein (ANDV-N; HTNV-N) were detected using the monoclonal antibody 1C12. Calnexin was used as loading control. One representative experiment out of three independent experiments is shown. (F) Fold change in total cellular BCL-2 in ANDV- and HTNV-infected, compared to uninfected, HUVECs. Expression was measured by band densitometry analysis using the software ImageJ and calculated as fold change increase compared to total cellular BCL-2 in uninfected cells at 72 hours p.i. Calnexin was used as loading control. Data shown represent the mean ± SD from three independent experiments. (G) Representative western blot of BCL-2 from lysates of ANDV-infected, HTNV-infected and uninfected HMVECs. ANDV and HTNV nucleocapsid protein (ANDV-N; HTNV-N) were visualized using the monoclonal antibody 1C12. Calnexin was used as loading control. One representative experiment out of three independent experiments is shown. (H) Fold change in total cellular BCL-2 in ANDV- and HTNV-infected, compared to uninfected, HMVECs. Expression was measured by band densitometry analysis using the software ImageJ and calculated as fold change increase compared to total cellular BCL-2 in uninfected cells at 72 hours p.i. Calnexin was used as loading control. Data shown represent the mean ± SD from three independent experiments. (I-J) NFkB (p65) activation analyzed from nuclear extracts obtained from ANDV-infected, HTNV-infected and uninfected HUVECs and HMVECs. TNF-α-stimulated HUVECs and HMVECs were used as positive controls for NFkB (p65) nuclear translocation. Total protein content in samples was quantified before analysis of NFkB (p65) activation. Data shown represent the mean ± SD from three independent experiments. Paired t test was used for statistical evaluation: **** p<0.0001, *** p<0.001, ** p<0.01, * p<0.05.

