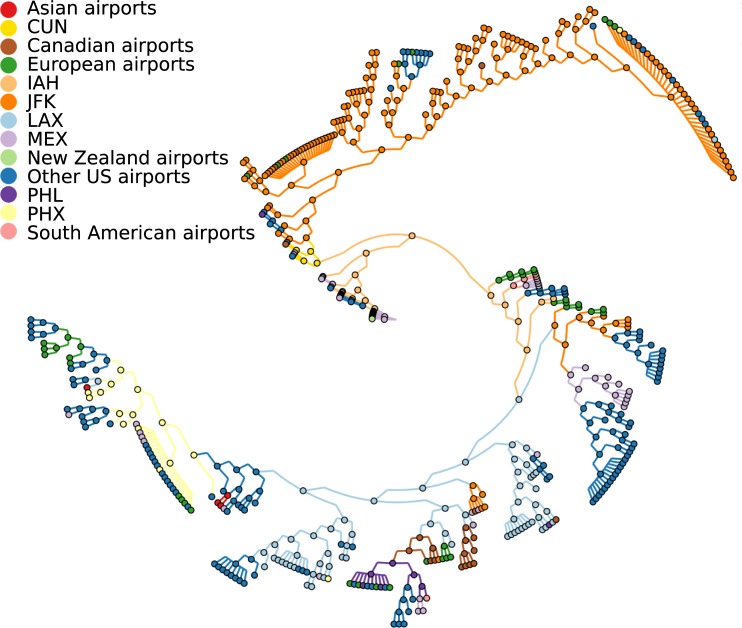
Fig 4. Phylogeny for pH1N1 viruses with reconstructed spread.
Parsimonious phylogeographic reconstruction using effective distances on 378 HA sequences from the early stage of the 2009 H1N1 influenza A pandemic. Sequences from 67 different locations were included and represented by the closest airports. The main airports involved in the spread (IAH (Houston), LAX (Los Angeles), JFK (New York), PHL (Philadelphia), PHX (Phoenix)) are shown in separate colors, together with Cancun (CUN), which was not observed in the data but was inferred for some internal nodes. All other locations were summarized per country or continent to allow their visualization. The tree was visualized using GraPhlAn [23].

