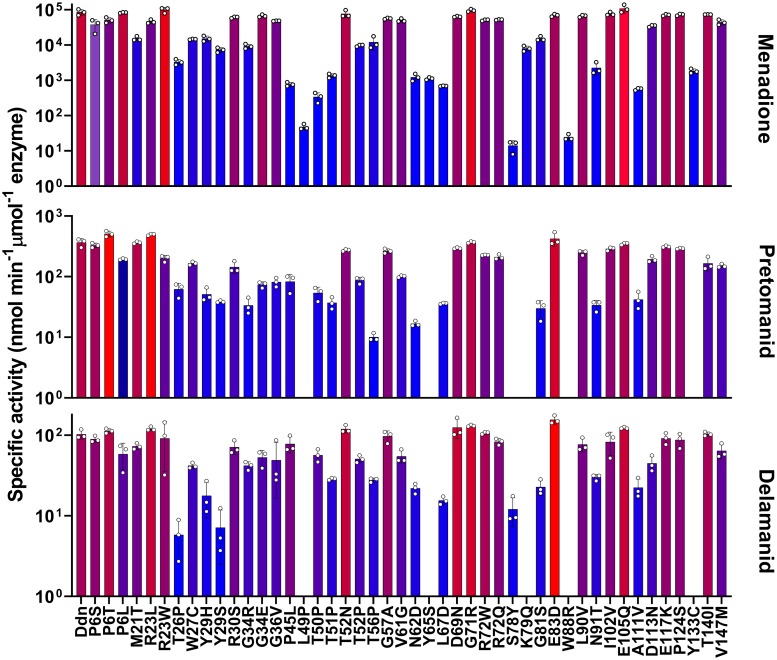
Fig 4. Natural sequence polymorphisms found in M. tuberculosis stains.
The activity of Ddn mutants with menadione, pretomanid, and delamanid. Bar color represents level of activity related to the rest of the graph with the highest activity colored red and the lowest activity colored blue. Error bars show standard deviations from three independent replicates. Data from this Figure is also present in Tables 2 and 3.

