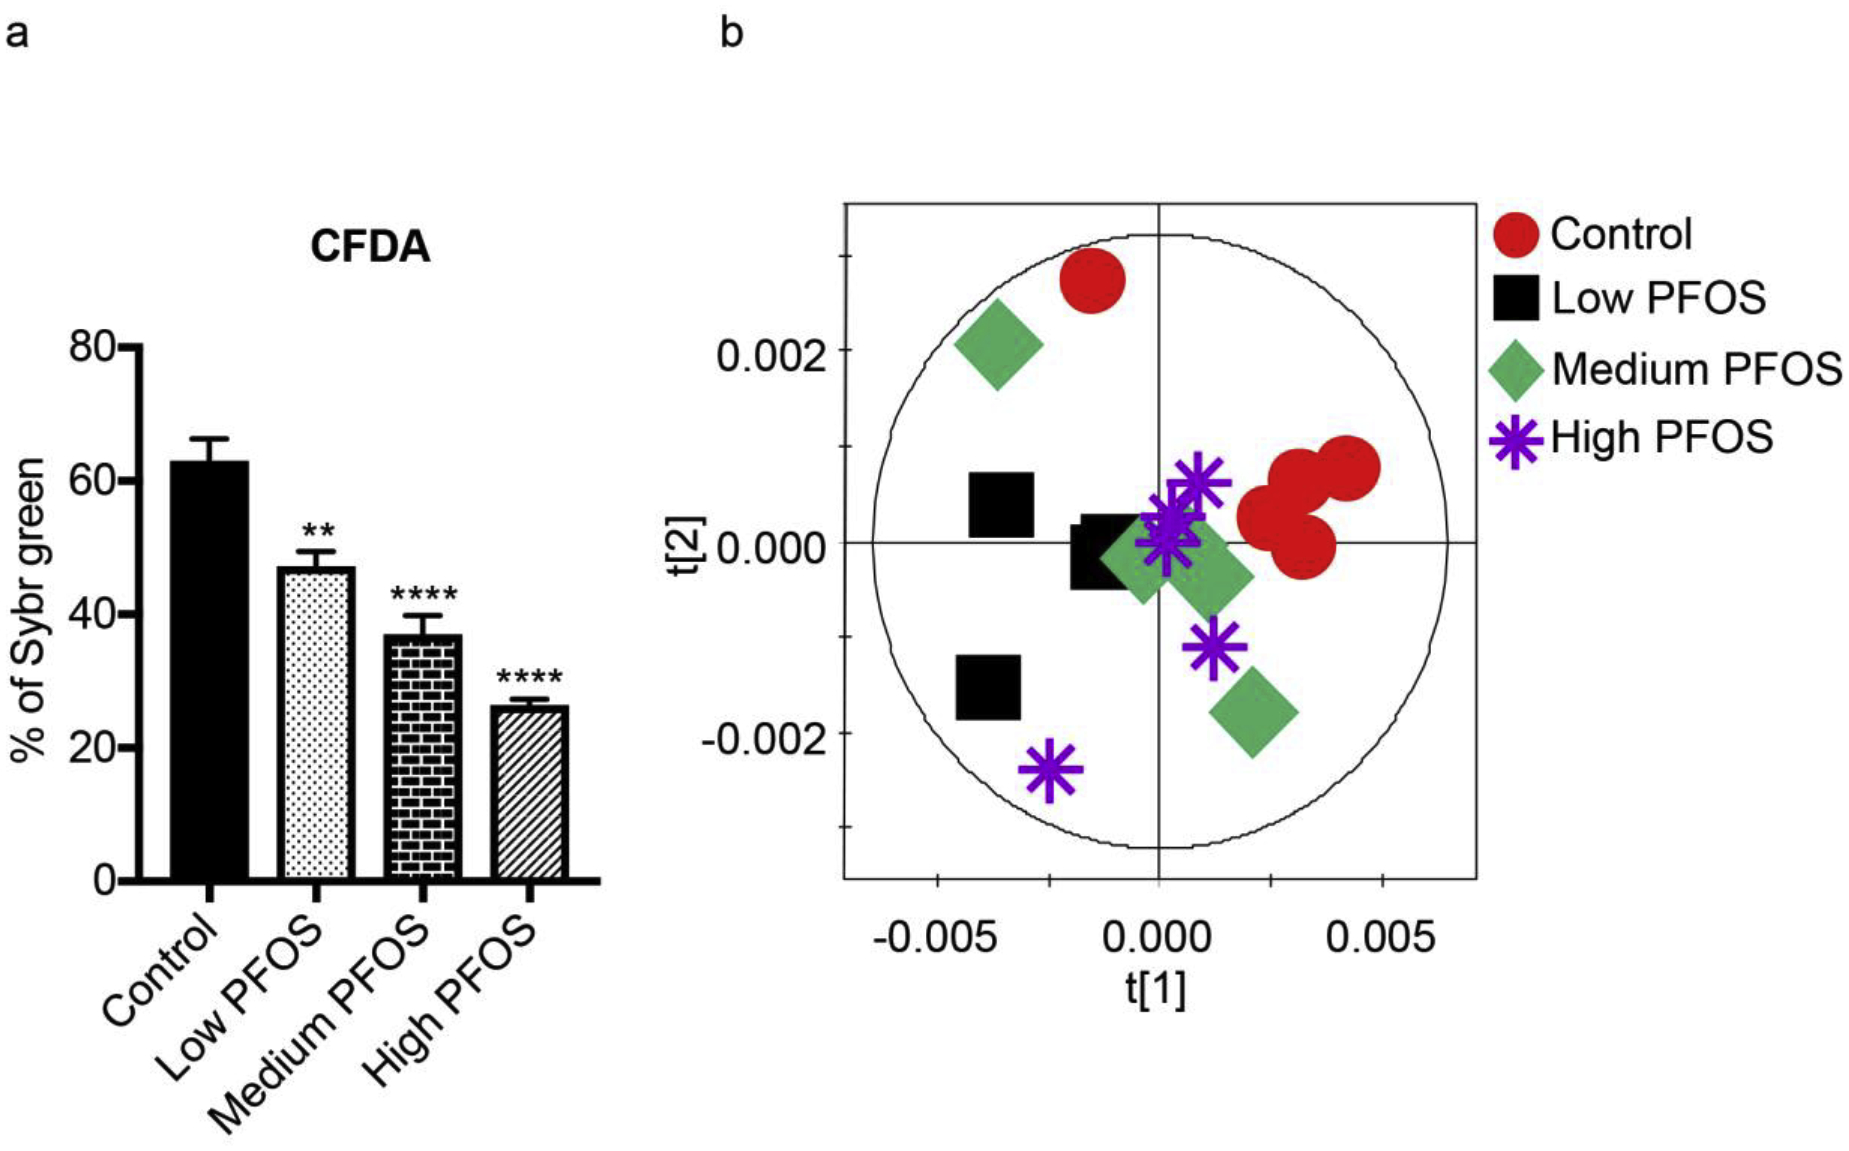
Fig. 7.

Direct PFOS exposure influences gut microbiome metabolism. a) The relative proportion of CFDA in the flow cytometric analysis of cecal content after PFOS treatment. Data were analyzed using one-way ANOVA with Tukey’s correction and are presented as means ± s. d., (n = 5 per group); *p < 0.05, **p < 0.01, ***p < 0.001, ****p < 0.0001 compared to control. b) Orthogonal projection to latent structure-discriminant (OPLS-DA) analysis scores plot derived from 1H NMR spectra of cecal content treated with control and three doses of PFOS.
