
Figure 6.
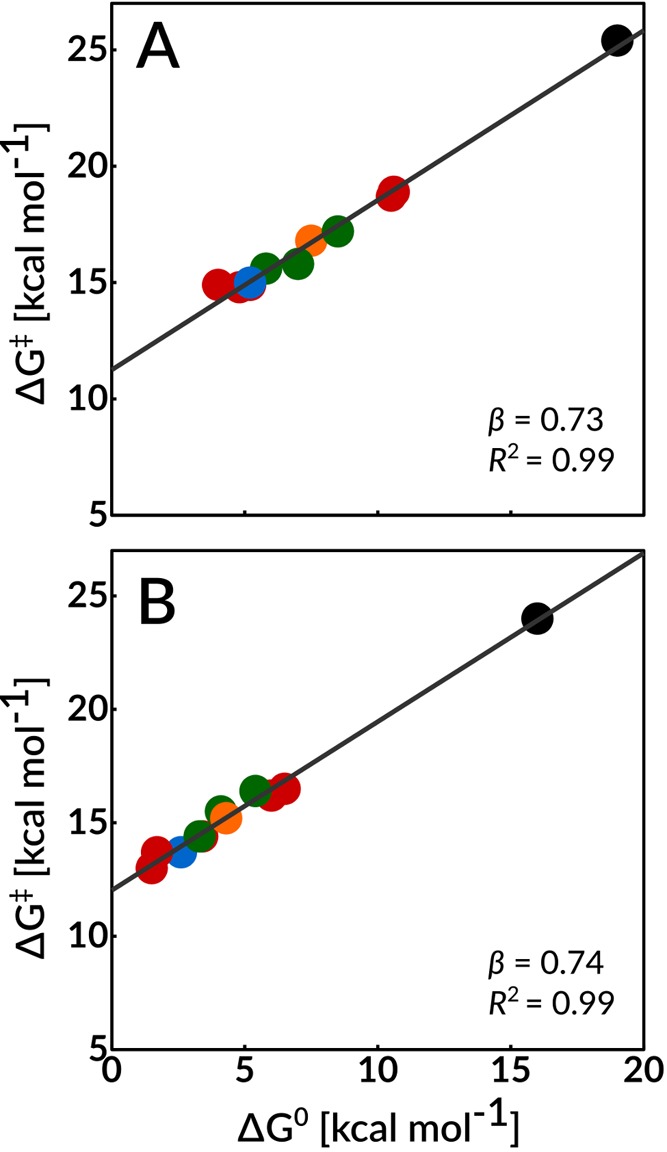
Linear free energy relationships between the activation free energies, ΔG⧧, and the reaction free energies, ΔG°, determined in this work using EVB simulations, for the deprotonation of DHAP and GAP catalyzed by wild-type TIM and all TIM variants described in this study. The correlation coefficients were calculated using regression analysis to be 0.994 and 0.995 for the deprotonation of substrates DHAP and GAP, respectively. In this figure, the black circles correspond to the nonenzymatic reaction in aqueous solution, the blue circles correspond to the wild-type enzyme, the red circles correspond to single substitutions of polar side chains (K12G and E97A), the green circles correspond to single substitutions of nonpolar side chains (P166A, I170A, and L230A), and finally, the orange circle corresponds to double substitutions of nonpolar side chains (I170A/L230A). The raw data used for this figure are provided in Table 1.