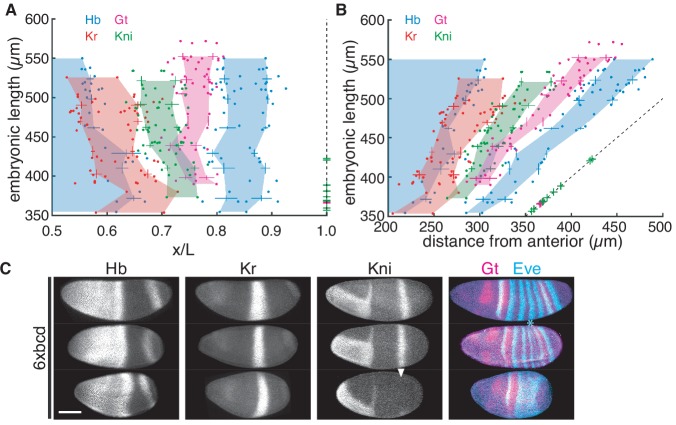
Figure 4. Embryonic patterning breaks down at A4 segment with bcd overexpression.
(A–B) Embryonic length of 6xbcd individuals plotted against the scaled (A) or absolute (B) AP position of four gap gene boundaries (Hb, blue; Gt, magenta; Kr, red and Kni, green). Data from every 30 µm EL interval were binned to compute mean and s.d. and the colored areas are generated by connecting mean values of different EL ranges. Dashed line indicates posterior boundary of individuals; green and magenta crosses overlapping the dashed line indicate individuals with corresponding EL not expressing Kni and Gt, respectively. (C) Representative segmentation gene expression in 6xbcd embryos with different EL. Asterisk indicates repressed Eve stripe five and arrowhead indicates failed activation of Kni. Scale bar, 100 µm.

