
Fig. 2. Observed site pattern frequencies.
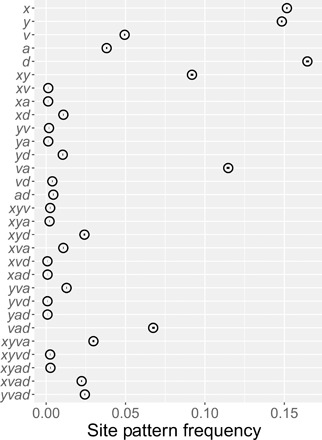
Horizontal axis shows the relative frequency of each site pattern in random samples consisting of a single haploid genome from each of X, Y, V, A, and D, representing Africa, Europe, Vindija Neanderthal, Altai Neanderthal, Denisovan, and superarchaic. Horizontal lines (which look like dots) are 95% confidence intervals estimated by a moving blocks bootstrap (35). Data: Simons Genome Diversity Project (SGDP) (14) and Max Planck Institute for Evolutionary Anthropology (11).