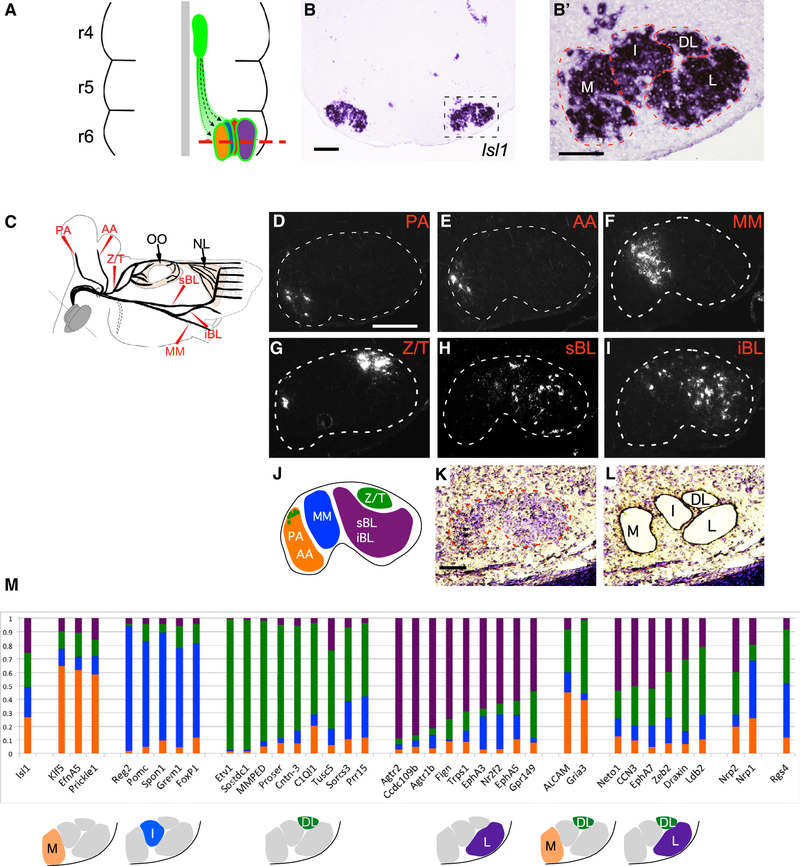
Figure 1. Molecular Heterogeneity among Somatotopic Facial Motor Subnuclei.
(A) Schematic of facial-motor nucleus development in the embryonic mouse hindbrain. Facial motor neurons (FMN) emerge from the rhombomere 4 (r4) midline germinal zone (green oval) and migrate caudally and laterally (dotted lines) to form somatotopic subnuclei in ventral r6. Red dashed line marks the plane of section for (B) and (B′).
(B and B′) In situ hybridization (ISH) for Isl1 in a transverse-hindbrain section through the facial nucleus at E16.5. Dashed box denotes position of high-power image (B′). Dashed lines in (B′) outline approximate anatomic borders of the medial (M), intermediate (I), dorsolateral (DL), and lateral (L) facial motor subnuclei.
(C) Schematic indicating the positions at which the posterior auricular (PA) and anterior auricular (AA), marginal mandibular (MM), zygomatic/temporal (Z/T), superior buccolabial (sBL) and inferior buccolabial (iBL) nerves were transected and marked with the retrograde rhodamine-dextran (Rh-Dex) tracer. Eyelid-closing orbicularis oculi (OO) and extrinsic whisking nasolabialis (NL) muscles are indicated. Dotted region represents the cervical (C) facial-nerve branch that was not included in the study
(D–I) Coronal sections through P2 mouse hindbrains after retrograde Rh-Dx labeling of the PA (D), AA (E), MM (F), Z/T (G), sBL (H), and iBL (I) facial nerve branches as described in (C). Dotted line denotes facial nucleus border.
(J) Schematic summary of the distribution of FMNs contributing to the indicated facial nerve branches.
(K and L) Cresyl violet-stained coronal section through the E16.5 wild-type facial nucleus (dashed line) before (K) and after (L) laser-capture microdissection (LCM) to isolate M, I, DL, and L facial subnuclei.
(M) Predicted subnucleus-specific enrichment of select markers identified in microarray screen. (Top) Histograms show genes for which a microarray probe showed approximately 40% or more total normalized expression enriched in a single subnucleus, color coded to represent the normalized expression in each of the subnuclei. (Bottom) Diagrams show predicted gene-expression patterns.
Scale bars: 200 μm in (B) and (D)–(I) and 100 μm in (B’) and (K).
See also Table S1 and Figures S1 and S6.

