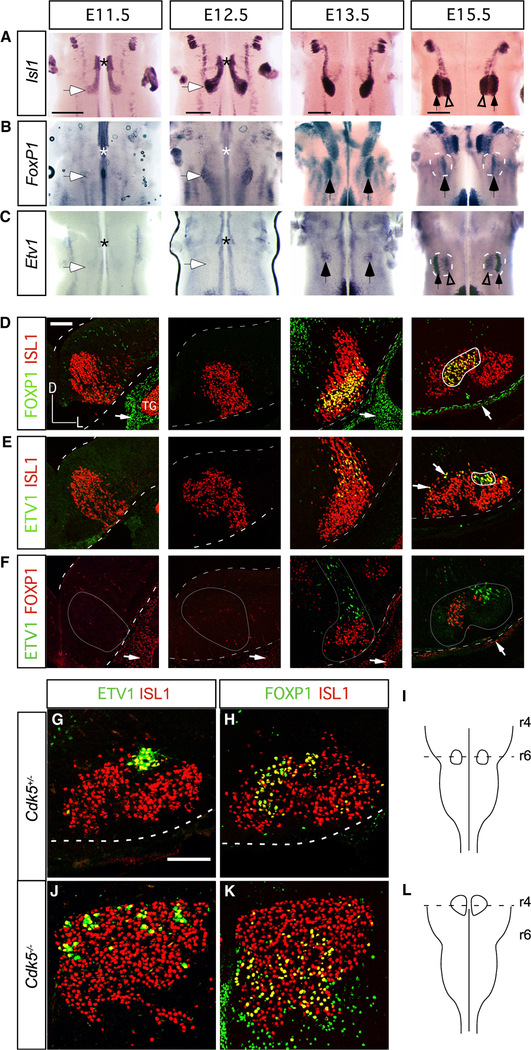
Figure 3. FMN Molecular Identity and Nerve-Branching Pattern Are Maintained in the Absence of Caudal Migration.
(A–C) Time course of Isl1 (A), FoxP1 (B), and Etv1 (C) expression in the developing hindbrain. Whole mount ISH, hindbrain ventral views. Asterisks indicate the r4 FMN germinal zone; white-filled arrows mark the final FMN settling position at E11.5 and E12.5; black-filled arrows indicate FoxP1-expressing I (B) and Etv1-expressing DL (C) subnuclei at E13.5 and E15.5; open arrowheads in (A) and (C) mark a subpopulation of Etv1-expressing FMNs occupying M positions within the E15.5 facial subnucleus.
(D–F) Immunofluorescence staining for FOXP1/ISLl (D), ETV1/ISL1 (E), and ETV1/FOXP1 (F) on coronal cryosections through r5/6 (E11.5 and E12.5) and r6 (E13.5 and E15.5). Dashed white lines outline the dorsal and ventral surfaces of the hindbrain; thick solid white lines in (D) and (E) outline DL and I facial motor subnuclei, respectively; thin gray lines in (F) outline the FMN migratory stream and nascent facial nucleus. Representative images, n = 3 embryos per time point.
(G–L) ETV1 (G and J) and FOXP1 (H and K) expression in control (G and H) and Cdk5−/−(J and K) FMNs at E16.5. Coronal planes of section indicated in (I) and (L), n = 1 Cdk5−/−, n = 1 wild-type littermate control.
Scale bars: 500 μm in (A)–(C) and 100 μm in (D)–(F), (G), (H), (J), and (K).
See also Figure S2.

