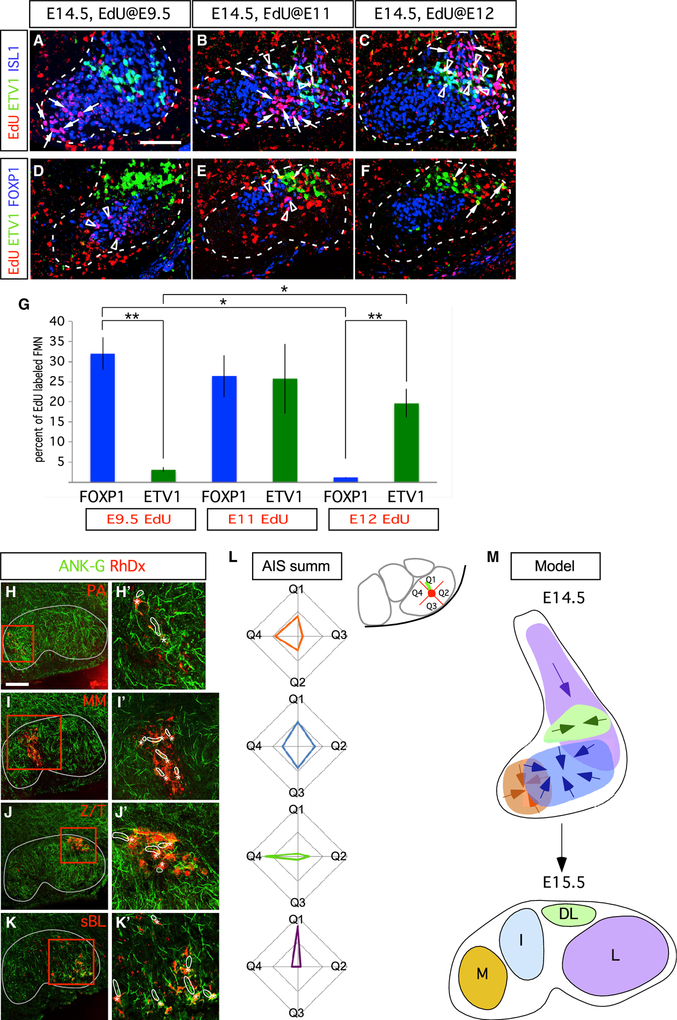
Figure 4. FMN Transcriptional and Positional Identities Are Linked to Birth Date and Secondary Migration within the Developing Facial Nucleus.
(A–F) FMNs settle in the ventral hindbrain along a mediolateral developmental axis. Time course of EdU birthdate labeling (red) combined with ETV1 (green) and ISL1 (blue) immunofluorescence in (A)–(C), and ETV1 (green) and FOXP1 (blue) immunofluorescence in (D)–(F). EdU administration at E9.5 marks M FMNs, whereas administration at E11 and E12 mark progressively more lateral FMN populations. Arrows indicate EdU+/ISL1ON in (A)–(C) and EdU+/ETV1ON in (D)–(F) cells; triangles show EdU+/ETV1ON/ISL1ON in (A)–(C) and EdU+/FOXP1ON in (D)–(F) cells.
(G) Percentage of EdU+/FOXP1ON and EdU+/ETV1ON detected at E14.5 after EdU delivery at the indicated time points represented as means ± SE. n = 3 embryos per injection time points E9.5 (290 ETV1ON and 1,013 FOXP1ON FMNs), E11 (639 ETV1ON and 859 FOXP1ON FMNs), and E12 (690 ETV1ON and 876 FOXP1ON). Unpaired t test, *p < 0.05, **p < 0.005.
(H–K) Ankyrin-G immunostaining (ANK-G, green) reveals variable axon initial segment (AIS) orientation among perinatal mouse facial subnuclei defined by retrograde Rh-Dx facial-nerve branch labeling (red); thin gray lines outline facial nucleus border. (H’–K’) High-power images of boxed regions; Rh-Dx labeled FMNs (asterisks) and corresponding AISs (outlined by thick white lines) are indicated. n = 3 mice per nerve branch.
(L) Radar plots indicating, for each subnucleus, the proportion of AISs assigned to the indicated directional quadrant bins (Q1–Q4); inset shows example diagram with an L FMN AIS (green) assigned to the Q1 bin. n = 3 mice each for each subnucleus, with 42 M, 65 I, 75 DL, and 80 L FMNs marked by retrograde labeling of the PA/AA, MM, Z/T, and BL nerve branches, respectively.
(M) Model for facial subnucleus formation through secondary migration based on marker expression and AIS orientation vectors. Directional vectors for final steps of secondary migration through which FMNs coalesce into discrete subnuclei are indicated.
Scale bars: 50 μm in (A)–(F) and 200 μm in (H)–(K).
See also Figure S6.

