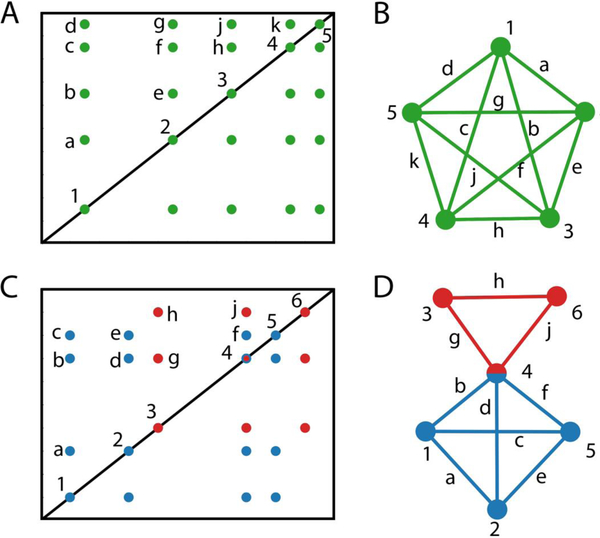
Figure 1.
Schematic illustration how a 2D TOCSY spectrum can be converted to a mathematical graph and interpreted in terms of maximal cliques. A. 2D TOCSY spectrum of a 5-spin system. B. Representation of connectivity information (cross-peaks) of A) as a maximal clique graph where the different spins correspond to nodes and cross-peaks to edges. C. 2D TOCSY spectrum of a mixture of a 4-spin system (blue) and a 3-spin system (red) where resonance 4 belongs to two overlapping resonances from each of the spin systems. D. Maximal clique analysis of TOCSY spectrum of C. The two maximal clique graphs (red and blue subgraphs), which are connected at node 4 due to spectral overlap, each belong to a separate spin system.

