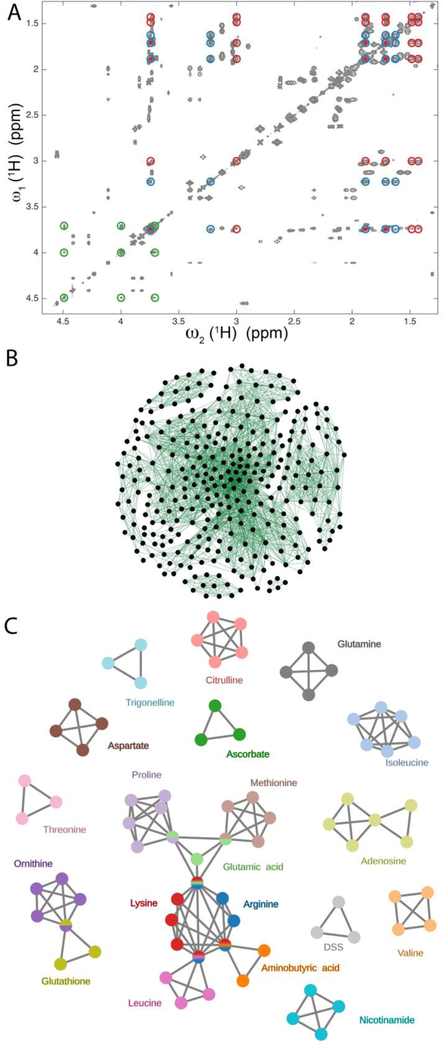
Figure 2.
Illustration of maximal clique method for the extraction of spin systems from redundant cross-peak information of a 2D TOCSY spectrum. A. Region of a 2D 1H-1H TOCSY spectrum of a 20-compound model mixture consisting of 19 metabolites and DSS. The red, blue, and green circles belong to lysine, arginine, and ascorbate, respectively, with lysine and arginine showing overlaps of three of their resonances. B. Representation of the 804 cross-peaks picked in the 2D TOCSY spectrum as a graph consisting of a total of 2600 edges and 306 nodes after removing all maximal cliques of size 2 (two nodes connected by an edge). C. Analysis of the graph of Panel B by the maximal clique method produces a non-redundant set of connected and disconnected maximal cliques that can be directly assigned to all spin systems of the mixture components that contain > 2 spins.

