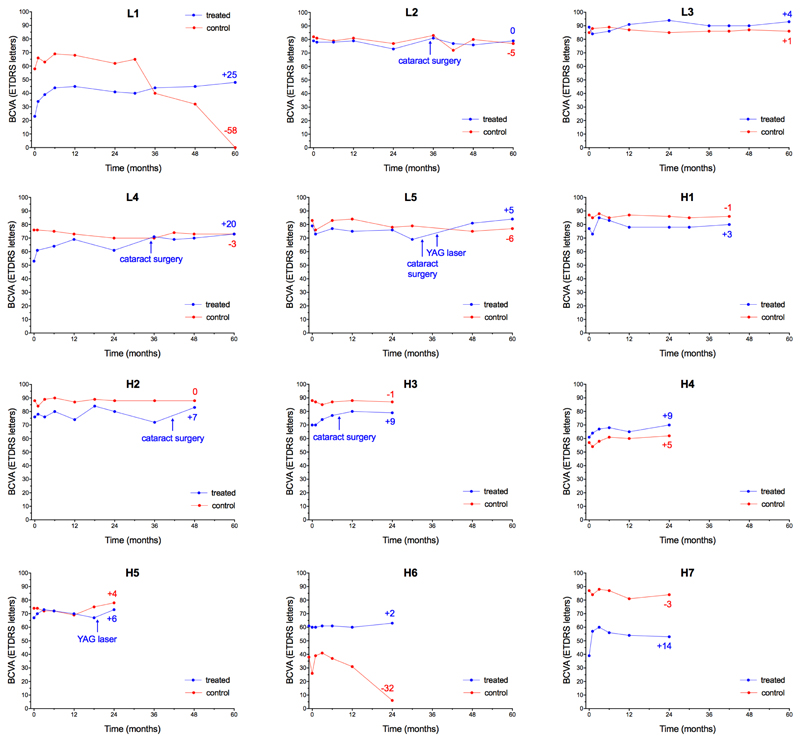
Figure 2.
Visual acuity changes in the 12 patients who received retinal gene therapy for choroideremia without complications as per protocol. Individual plots of best-corrected visual acuity (BCVA) measured as number of letters read (out of 100) on the ETDRS chart at 4 m in the treated (blue) and control (red) eyes (dots represent each follow-up visit). Participants L1-5 received low dose (1x10¹⁰ gp) of the vector, while H1-7 received high-dose (1x10¹¹ gp) of vector. Positive or negative numeric values at the end of each line indicate change from baseline visual acuity at the last follow-up (number of letters). Four patients (L2, L4, L5 and H2) had cataract surgery in the treated eye after the 2-year trial endpoint. One patient (H3) had cataract surgery during the trial period, but the visual acuity gain had already occurred by that point. H5 received gene therapy in a pseudophakic eye. L5 and H5 also received subsequent YAG laser capsulotomy for opacification of the posterior lens capsule, which is common after cataract surgery. In H6, the low visual acuity in the worse eye led to fluctuations in ETDRS readings. Following discussion with the patient, it was decided to treat the eye with better BCVA (60 letters) instead. Note that this made H6 complementary to L1, as both had asymmetric visual acuities: in L1 the worse eye was treated, leading to a sustained visual acuity gain that eventually overtook the formerly better eye; whereas in H6 gene therapy was applied to the better eye, stabilizing the visual acuity whilst the untreated eye declined further. The pattern of a significant early acuity gain which is then sustained is also seen in L4 and H7. Each plot represents multiple test points to reduce variability – up to ten times over 5 years in the first 5 patients.

