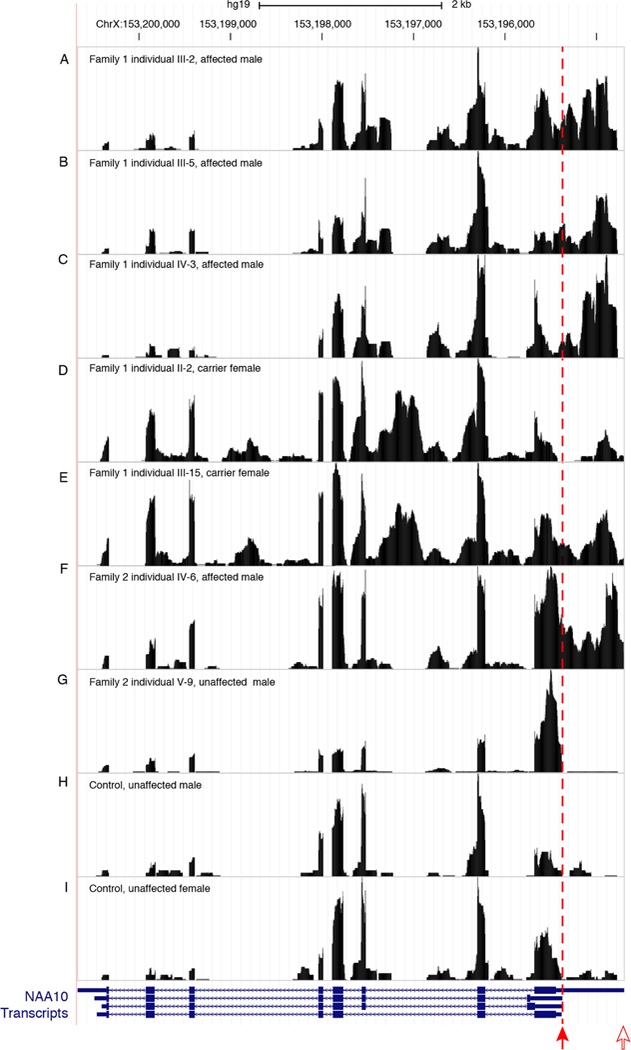
Figure 3.

RNA-seq data comparing reads from four affected individuals, two carrier females and three control individuals, one female and two males, for NAA10. The variant positions in the NAA10 polyadenylation signal are marked by a filled red arrow. Transcription in affected individuals (family 1, individuals III-2, III-5 and IV-3 and family 2, individual IV-6) and carrier females (family 1, individuals II-2 and III-15) continues past the normal polyadenylation cleavage site and uses a cryptic signal approximately 600 bp downstream at an alternate polyadenylation cleavage site depicted by an open red arrow. NAA10 gene models are from GENCODE V.19 as included in the UCSC genome browser (GRCh37/hg19).
