Figure 3.
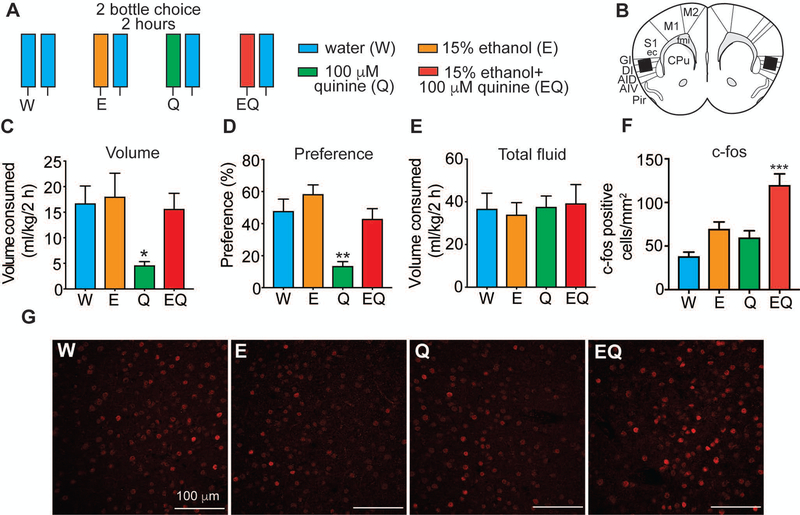
c-fos is induced in the insula of mice drinking quinine-adulterated ethanol. A, Experimental design. Experimentally naïve mice were given a 2-bottle choice test for 2 h followed by perfusion and collection of brain tissue for immunohistochemistry with a c-fos antibody. Mice were divided into 4 groups (n = 6 per group) and given different 2-bottle choice tests: water (W) vs. W, ethanol (E) vs. W, quinine (Q) vs. W, and ethanol plus quinine (EQ) vs. W. B, Diagram of area in which c-fos counts were obtained based on the mouse brain atlas. Black box shows area where counts were taken. C, Volume of one bottle consumption of W, E, Q, and EQ in ml per kg body weight. *p < 0.05 by Tukey’s post-hoc multiple comparisons test when comparing Q to E. D, Percent preference of each solution (W, E, Q, or EQ), calculated as volume of solution consumed divided by total volume consumed. **p < 0.01 by Tukey’s post-hoc multiple comparisons test when comparing Q to all other groups. E, Total fluid consumed in ml per kg body weight. F, Number of c-fos positive cells in the insula of mice drinking W, E, Q, and EQ. ***P < 0.001 when by Tukey’s post-hoc multiple comparisons test when comparing EQ to all other groups. Data are presented as average c-fos counts from 6 mice per group and 4–5 sections per mouse. G, Representative images showing c-fos immunoreactivity in the insula 2 h after consuming W, E, Q, and EQ. Scalebars, 100 μm. Data are plotted as the mean ± SEM.

