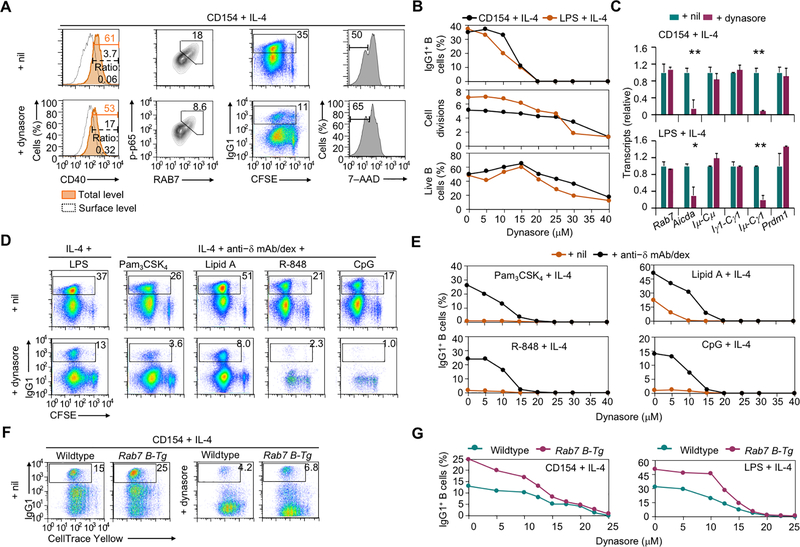
FIGURE 8.
CD40 internalization in activated B cells promotes NF-κB activation and CSR. (A) Flow cytometry analysis of CD40 internalization, intracellular RAB7 expression and levels of phosphorylated p65 in B cells stimulated with CD154 plus IL-4 for 24 h and treated with nil (DMSO) or dynasore (left two columns), and CSR to IgG1 and viability (7–AAD–) in CFSE-labeled B cells stimulated with CD154 plus IL-4 for 96 h and treated with nil or dynasore (right two columns). Representative of three independent experiments. (B) Flow cytometry analysis of IgG1+ cells (top), average divisions completed by B cells (middle) and proportion of 7–AAD– live B cells (bottom) after CFSE-labeled B cells were stimulated with CD154 or LPS plus IL-4 and treated with dynasore at different doses for 4 d. Representative of two independent experiments. (C) Levels of different transcripts in B cells stimulated with CD154 (top) or LPS (bottom) plus IL-4 and treated with nil (DMSO) or dynasore. Data were normalized to the values in nil-treated B cells (mean and s.d., triplicates). Representative of two independent experiments. (D, E) Flow cytometry analysis of IgG1+ B cells after CFSE-labeled B cells were stimulated with LPS (left) or different TLR ligands together with anti–IgD mAb/dex (right) plus IL-4 and treated with nil (DMSO) or dynasore at 15 μM (D) or different doses (E) for 4 d. Proportions of IgG1+ B cells were depicted in the histograms (E). Representative of two independent experiments. (F,G) Flow cytometry analysis of IgG1+ B cells after CellTrace Yellow-labeled wildtype and Rab7 B-Tg B cells were stimulated with CD154 plus IL-4 and treated with nil (DMSO) or dynasore at 15 μM (F) or different doses (G) for 4 d. Representative of three independent experiments. *, p < 0.05; **, p < 0.01.

