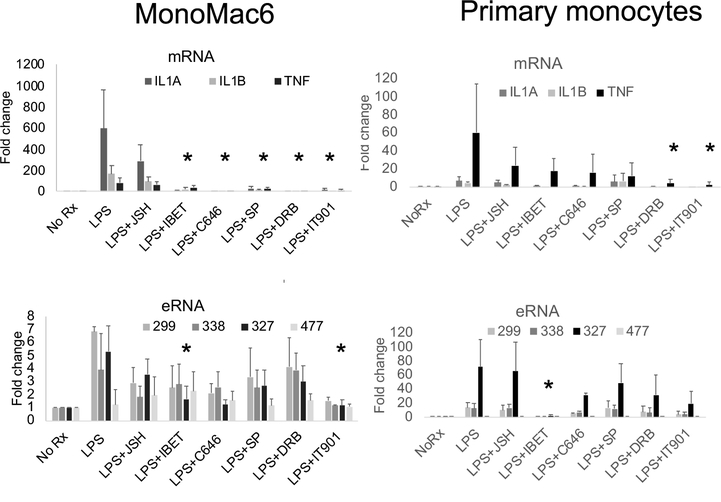
Figure 2. Analysis of LPS induction of RNAs.
MonoMac6 cells and primary monocytes were treated with 1μg/ml LPS for 90 minutes. Total RNA was extracted and qRT-PCR was performed. IL1A, IL1B and TNF were examined as mRNAs. The inhibitors JSH-23, iBET151, C646, SP600125, DRB, and IT901 were tested for effects on RNA abundance. These graphs represent the mean of n=3 biological replicates (error bars represent SD). The asterisks indicate a consistent statistical significance across all measured RNA species (except TNF for mRNAs and 477 eRNAs which represent controls). Supplemental Figure 1 provides additional detailed views of the data in a time course.

