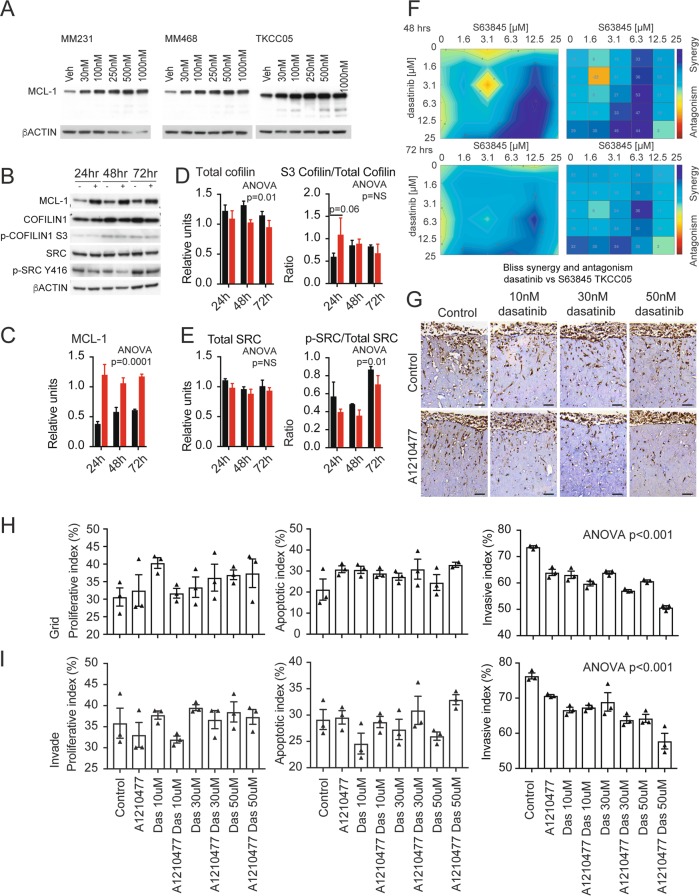
Fig. 2.
a Western blots of MCL-1 and beta ACTIN from MDA-MB-231, MDA-MB-468 breast cancer and TKCC05 pancreatic cancer cells treated with increasing concentrations of S63845. b Western blots and densitometry quantification of MCL-1 (c), total Cofilin (d, left panel), ratio of S3 phosphorylated Cofilin/total Cofilin (d, right panel), total SRC (e, left panel), the ration of Y416 phosphorylated SRC to total SRC (e, right panel) from TKCC05 pancreatic cancer cells treated with 250 nM S63845 over a 72 h period and normalized to beta ACTIN. N = 4 independent experiments, error bars, unpaired t-tests between groups and two-way ANOVA for treatments (vehicle vs. S63845) indicated. f Bliss synergy contour plot (left panels) and synergy matrix (right plots) of TKCC05 pancreatic cancer cells treated with increasing concentrations (0–25 µM) of S63845 and dasatinib at 48 h (upper panels) and 72 h (lower panels). g Representative immunohistochemistry using an antibody to human Vimentin on TKCC05 pancreatic cancer cells invading into fibrillar Collagen I organotypic matrices and treated with the indicated concentrations of A1210477 and dasatinib (h, i). Bar graphs showing the quantification of Ki67 (proliferating cells, left panels), cleaved caspase 3 (apoptotic cells, middle panels) and Vimentin (invasion index, right panels) of TKCC05 pancreatic cancer cells treated with the indicated concentrations of A1210477 and dasatinib at seeding (upper panels, grid) or 5 days after seeding (lower panels, invade). Error bars and two-way ANOVA p-value between treatments indicated

