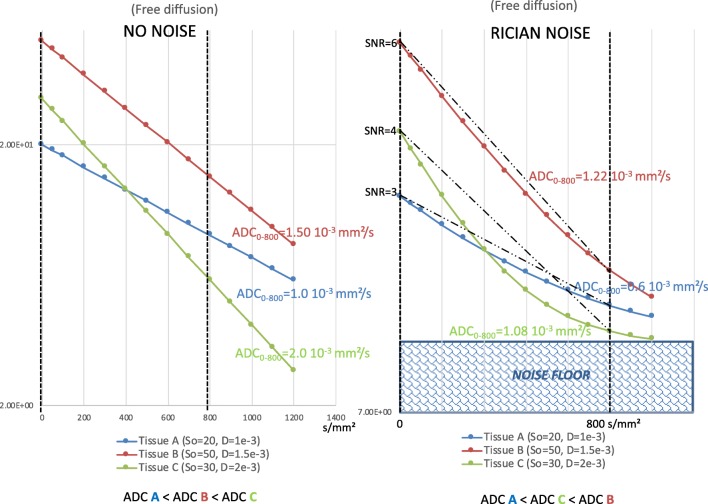
Fig. 2.
An example of the effect of the noise floor on the observed ADC values. For three hypothetical tissues with free diffusion (no hindrance/restriction effect for simplicity), in the absence of noise (left), the slope gives the ADC values of 1.0, 1.5, and 2.0 10-3 mm2/s, respectively, for tissues A, B, and C. However, in the presence of noise (right), the noise floor leads to curvature of the signal decay. As a result, the ADC values change. In this example, we measured 0.6, 1.22, and 1.08 10-3 mm2/s, respectively, for tissues A, B, and C. It should be noted that the observed ADC value in tissue B is now higher than that in tissue C. This order no longer reflects diffusion, but the amount of signal at b = 0 s/mm2, which depends solely on tissue magnetization properties (A has the lowest signal level and B the highest). Consequently, a low SNR may result in misclassification of the diffusion level of a lesion. S0 indicates the signal intensity at b = 0 s/mm2, and D = diffusion coefficient

