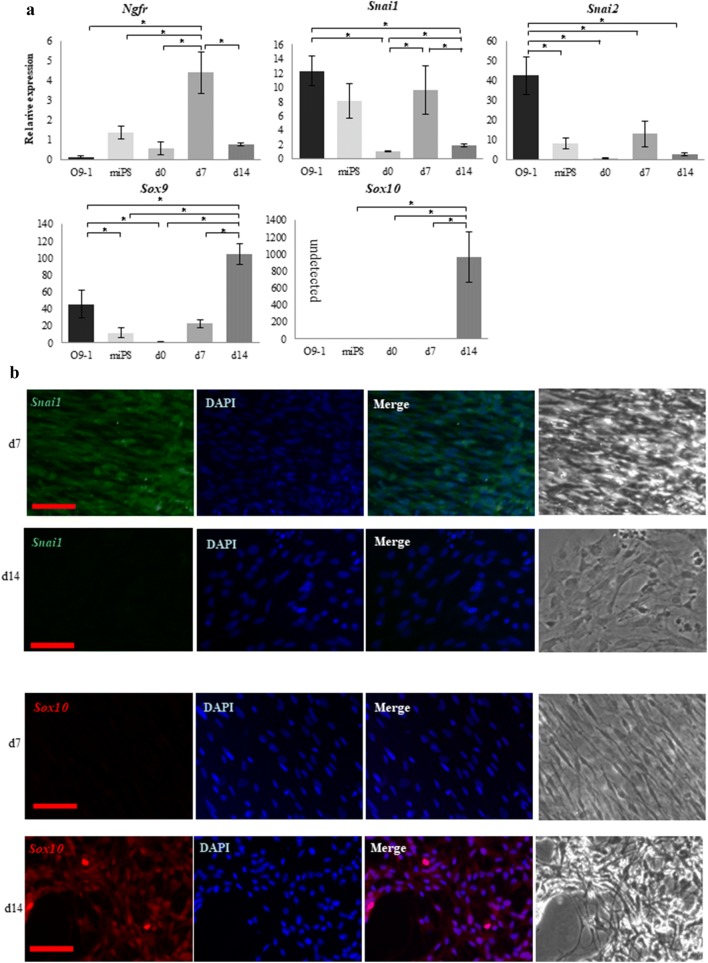
Fig. 2.
Comparison between O9-1 cells and cranial neural crest cells (cNCCs) derived from mouse-induced pluripotent stem (miPS) cells using quantitative reverse transcription polymerase chain reaction (qRT-PCR) and immunostaining. a Expression of the premigratory neural crest (NC) markers Ngfr, Snai1, and Snai2 and the migratory NC and cNC markers Sox9 and Sox10. Expressions of the premigratory NC markers increased in day 7 (d7) cells, whereas those of the migratory markers increased in d14 cells. Sox10 was not detected in O9-1 cells. Each experiment was performed in triplicate, with values representing mean ± SD. Groups were compared using ANOVA, followed by the Bonferroni test: *p < 0.05. b Immunostaining of d7 and d14 cells. Sox10 was more highly expressed in the d14 cells, whereas Snai1 was more highly expressed in the d7 cells. Scale bar 50 μm

