Fig. 6.
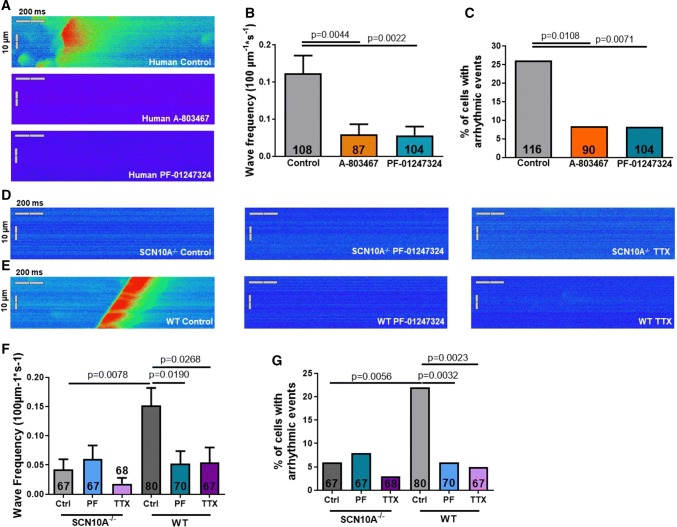
Effects of NaV1.8 on diastolic Ca2+ waves. Data are presented as mean ± SEM. P values were calculated using one-way ANOVA with Tukey's test for multiple comparisons or Fisher's exact test (for c, g). a Confocal line scan images of human atrial cardiomyocytes loaded with the Ca2+ indicator Fluo-4 representing the occurrence of major diastolic arrhythmogenic Ca2+ release events. b Mean frequency of Ca2+ waves in control (n = 108 cardiomyocytes/13 patients) and after treatment with A-803467 (n = 87/9) or PF-01247324 (n = 104/11). c Percentage of cells developing arrhythmic events (Ca2+ waves or spontaneous transients; n = 24 of 116 cardiomyocytes/13 patients) and effects of NaV1.8 blockade with A-803467 (n = 7 of 90/9 patients) or PF-01247324 (n = 8 of 104/11 patients). d Representative original line scans of murine atrial cardiomyocytes from SCN10A−/− and (e) WT mice. f Mean values of Ca2+ wave frequency and (g) proportion of cells showing arrhythmic events in SCN10A−/− (n = 67 cells/7 mice) and WT (n = 80 cells/7 mice) mice and effects of NaV1.8 inhibition by PF-01247324 (SCN10A−/−: n = 67 cells/7 mice and WT: n = 70/7) and TTX (SCN10A−/−: n = 68 cells/7 mice and WT: n = 67/7) in both genotypes

