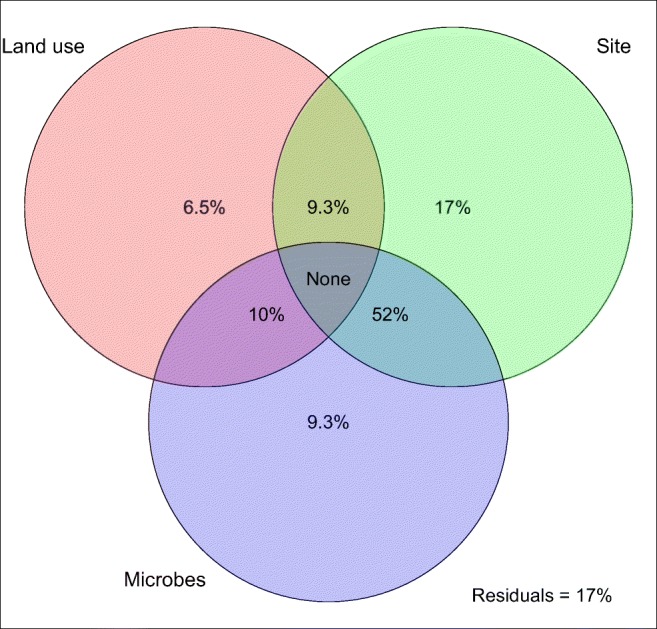
Fig. 3.

Variation partitioning Venn diagram depicting variation in soil humic organic C (HOC; organic C with particle size below 50 μm) explained by different land uses (old-growth forest, plantation, pasture; left circle), sites (sampling locations; right circle) and soil microbial function and composition combined (see earlier sections for detail; bottom circle). The sum of numbers in a circle represents the proportion of variation in HOC explained by that predictor. Numbers in overlapping areas represent variation explained by both predictors equally. Numbers outside of overlapping areas depict variation explained uniquely by a predictor. ‘Residuals’ represents variation not explained by any of the predictors. Note, the explained variance does not sum to 100% as an artefact of the variance partitioning algorithm inherent to this analysis
