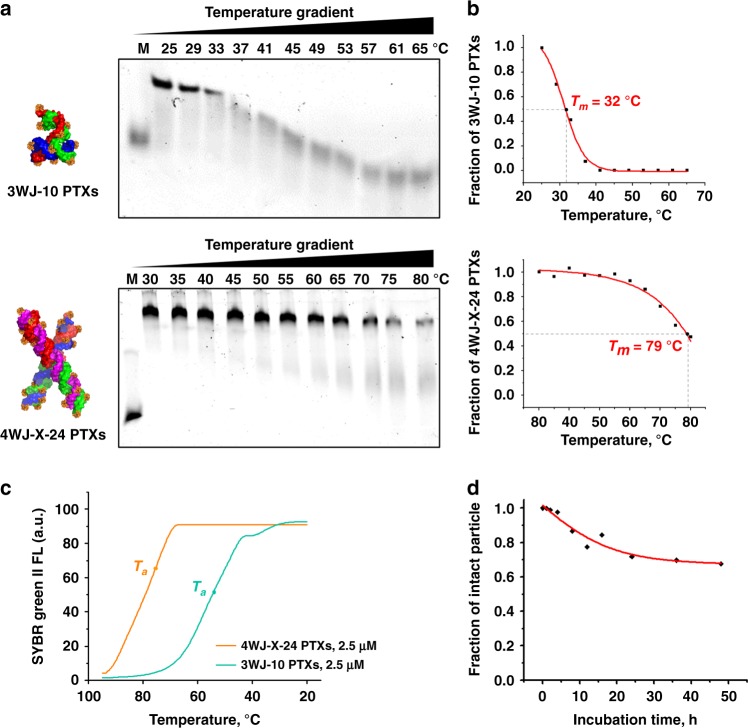
Fig. 4. Thermodynamic and chemical stability of 4WJ-X-24 PTXs nanoparticles.
a Representative TGGE showing the Tm of 3WJ-10 PTXs (M = 20 nucleotides monomer) and 4WJ-X-24 PTXs (M = 40 nucleotides monomer) nanoparticles. b Quantitative calculation of Tm from the representative TGGE for 3WJ-10 PTXs and 4WJ-X-24 PTXs nanoparticles. c Ta comparison of 4WJ-X-24 PTXs (orange) and 3WJ-10 PTXs (green) nanoparticles in a representative annealing curve, measured by RT-PCR (n = 3 independent samples over three independent measurements). d Enzymatic stability curve of 4WJ-X nanoparticles after incubation in 50% FBS at 37 °C over time points. Source data are provided as a Source Data file.

