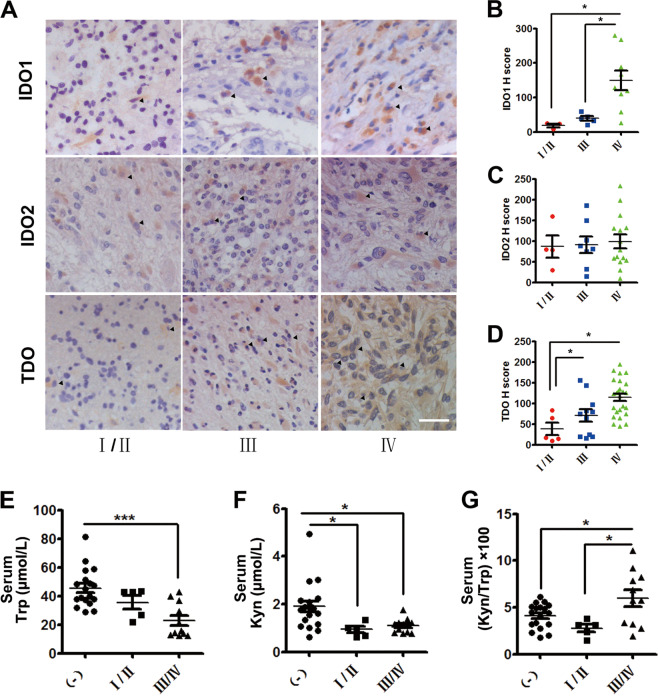
Fig. 1. The expression and activity of IDO1/TDO were positively correlated with the pathologic grades of glioma.
a Immunohistochemistry analysis of the expression of IDO1, IDO2, and TDO in gliomas of different pathologic grades (WHO grades I–IV. Upper panel: IDO1. Middle panel: IDO2. Lower panel: TDO. IDO1, IDO2, and TDO-positive cells (arrows). Magnification, ×200; scale bar, 100 μm). b Plot of IDO1 expression in gliomas of different pathologic grades (WHO grades I–IV: grade I/II, n = 3; grade III, n = 5; grade IV, n = 9). c Plot of IDO2 expression in gliomas of different pathologic grades (WHO grades I–IV: grade I/II, n = 4; grade III, n = 8; grade IV, n = 15). d Plot of TDO expression in gliomas of different pathologic grades (WHO grades I–IV: grade I/II, n = 5; grade III, n = 11; grade IV, n = 25). e–g HPLC analysis of Trp and Kyn levels and the Kyn/Trp ratio in the serum of 16 patients with glioma (grade I/II, n = 5; grade III/IV, n = 11) and 18 non-glioma patients. (−), non-glioma patients. I/II, WHO grades I and II; III/IV, WHO grades III and IV. Statistical significance was determined by one-way ANOVA followed by Dunnett’s test; data are presented as the mean ± SEM. *p < 0.05; ***p < 0.001.

