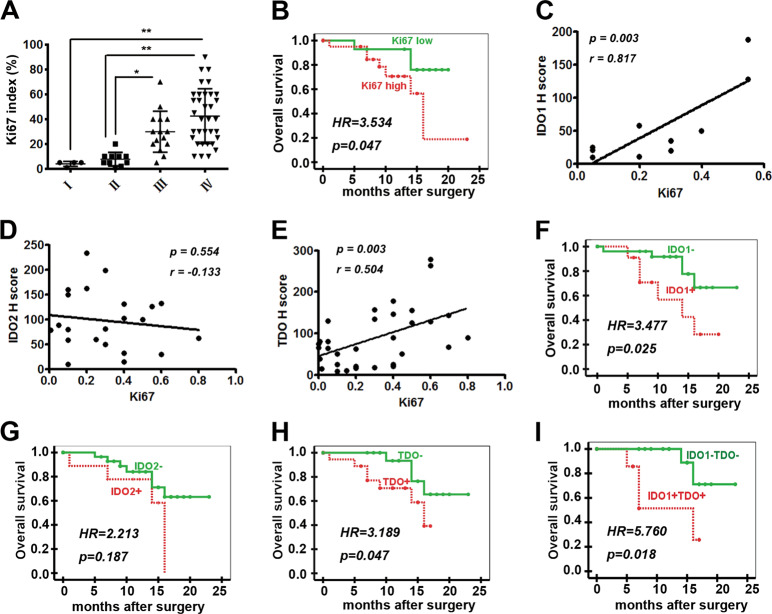
Fig. 2. The expression of IDO1/TDO was negatively correlated with the prognosis of patients with glioma.
a Ki67 index in gliomas of different pathologic grades (I: 4, II: 10, III: 15, and IV: 34). b Correlation between overall survival and the Ki67 index (Ki67 low, n = 17; Ki67 high, n = 23). c–e Correlation between the Ki67 index and H scores of IDO1 (n = 10), IDO2 (n = 22), and TDO (n = 34). f–i Correlation between overall survival and the expression of IDO1, IDO2, and TDO (IDO1 + , n = 13; IDO1−, n = 30; IDO2 + , n = 12; IDO2−, n = 31; TDO + , n = 23; TDO−, n = 20; IDO1 + TDO + , n = 9; IDO1–TDO−, n = 16). Statistical significance was determined by one-way ANOVA followed by Dunnett’s test; data are presented as the mean ± SEM (a). Kaplan–Meier curves of overall survival of patients with glioma were determined by log-rank test (b, f–i). Survival time is the interval between diagnosis and tumor-specific death, progression, or the last follow-up. *p < 0.05; **p < 0.01.

