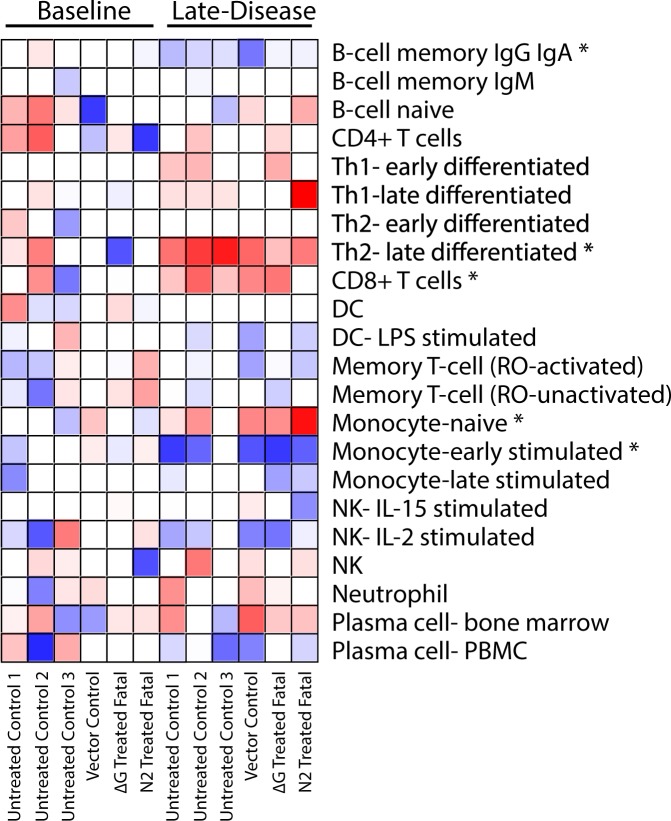
Figure 3.
ImmQuant heatmap analysis of the relative contribution of immune cell subsets to differential gene expression. Results were calculated using ImmQuant, a database based on genome-wide microarray expression profiling of human immune cells, and the IRIS algorithm that incorporates human-based FACS marker genes. The algorithm infers an increase (red) or decrease (blue) in cell-type quantities relative to a pre-challenge baseline. *Statistically significant (FDR-adjusted p-value ≤ 0.05) putative change in the cell subset frequency.

