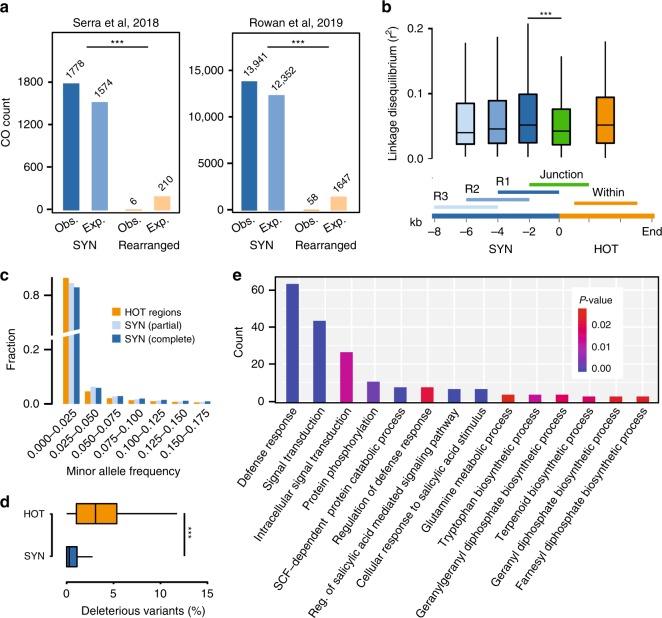
Fig. 5. The causes and consequences of hotspots of rearrangements.
a Crossover (CO) breakpoints35,36 identified in Col-0 x Ler hybrids were checked for their overlaps in syntenic or rearranged regions. Only unique CO intervals smaller than 5 kb were used. Obs.: observed. Exp.: expected. One-sided χ2 test was used. b Linkage disequilibrium (LD) calculated in 4 kb windows in and around each of the 576 HOT regions as shown in the lower part. SYN, syntenic region. LD was calculated as the correlation coefficient (r2) based on informative SNP markers (MAF > 0.05, missing rate < 0.2) selected from the 1001 Genomes Project data8. One-sided U test was used. c Minor allele frequency of SNP markers in 10,331 syntenic, 10,501 partially syntenic, and 576 HOT regions. The SNP markers (MAF > 0.005, missing rate < 0.2) from 1001 Genomes Project were used. d Frequency of deleterious mutations in 10,331 syntenic (SYN) regions and 576 HOT regions. Deleterious mutations include SNPs and small indels that introduce premature stop codons, loss of start or stop codons, frameshifts, splicing sites mutations or deletions of exons. One-sided U test was used. e GO term enrichment analysis of protein-coding genes in 576 HOT regions. Fisher exact test used, p < 0.05. In box plots b and d, centre line: median, bounds of box: 25th and 75th percentiles, whiskers: 1.5 * IQR (IQR: the interquartile range between the 25th and the 75th percentile). p < 0.001: ***. Source Data are provided as a Source Data file.

