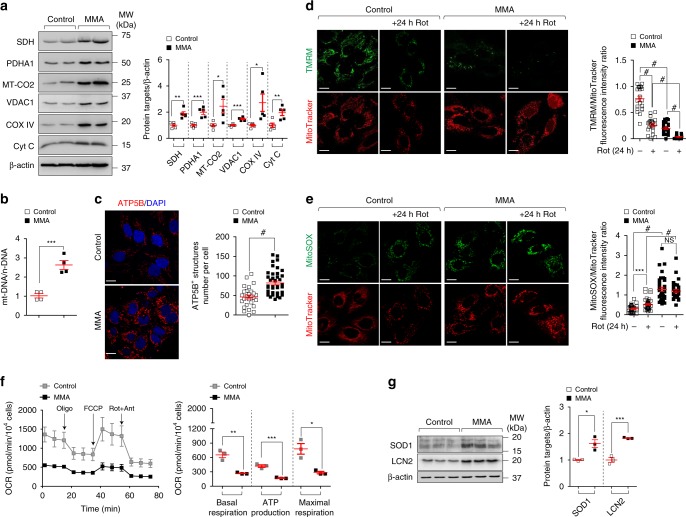
Fig. 2. Mitochondrial dysfunctions in MMA kidney cells.
a Representative immunoblotting and quantification of the indicated mitochondrial proteins; n = 5 biologically independent experiments. b The ratio between mitochondrial DNA (ND1) and nuclear DNA (ACTB) was determined by quantitative PCR; n = 4 biologically independent experiments. c Cells were immunostained for ATP5B (red) and imaged by confocal microscopy. Representative images and quantification of numbers of ATP5B+ structures per cell (n = 27 control cells and n = 40 MMA cells pooled from three biologically independent experiments). Nuclei counterstained with DAPI (blue). d, e Cells were exposed to mitochondrial complex I inhibitor Rotenone (Rot, 5 μM). After 24 h of treatment, the cells were loaded (d) with tetramethylrhodamine methyl ester (TMRM; green; mitochondrial membrane potential fluorescent probe, 50 nM for 30 min at 37 °C) and MitoTracker (red; fluorescent probe that localizes to mitochondria; 1 μM for 30 min at 37 °C) or (e) with MitoSOX (green; mitochondrial ROS indicator, 2.5 μM for 25 min at 37 °C) and MitoTracker (red), and analysed by confocal microscopy. Representative images and quantification of d membrane potential and e mitochondrial ROS (both calculated as ratio between TMRM and MitoTracker or MitoSOX and MitoTracker fluorescence intensities, with each point representing the average fluorescence intensity ratio in a cell). TMRM/MitoTracker: n = 21 untreated and Rot-treated control cells, n = 22 untreated MMA cells and n = 18 Rot-treated MMA cells. MitoSOX/MitoTracker: n = 31 untreated control cells and n = 40 Rot-treated control cells n = 36 untreated MMA cells and n = 31 Rot-treated MMA cells. Values are pooled from three biologically independent experiments. f Oxygen consumption rate (OCR) and individual parameters for basal respiration, ATP production and maximal respiration. OCRs were measured at baseline and after the sequential addition of Oligomycin (Oligo, 1 μM), FCCP (0.5 μM) and Rotenone (Rot; 1 μM) + Antimycin A (Ant; 1 μM), n = 3 biologically independent experiments. g Immunoblotting and quantification of the indicated proteins; n = 3 biologically independent experiments. Plots represent mean ± SEM. Two-tailed Student’s t-test, *P < 0.05, **P < 0.01, ***P < 0.001 and #P < 0.0001 relative to untreated or to Rot-treated control cells or to untreated MMA cells. β-actin was used as a loading control in a and b. Scale bars, 10 μM. NS non-significant. Source data are provided as a Source Data file.

