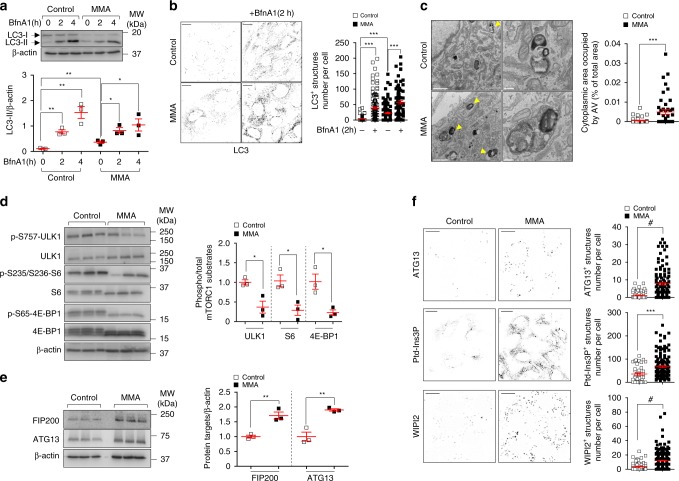
Fig. 4. MMUT deficiency stimulates autophagy in MMA kidney cells.
a, b Cultured cells were exposed to lysosome-based proteolysis inhibitor Bafilomycin A1 (BfnA1, 250 nM for the indicated times). Representative immunoblotting and quantification of LC3-II; n = 3 biologically independent experiments. Two-tailed Student’s t-test, *P < 0.05 and **P < 0.01 relative to untreated control or MMA cells. b Representative inverted images and quantification of numbers of punctate LC3+ structures per cell; n = 122 untreated control cells, n = 127 BfnA1-treated control cells, n = 127 untreated MMA cells and n = 77 BfnA1-treated MMA cells. Values are pooled from three biologically independent experiments. One-way ANOVA followed by Bonferroni’s post hoc test, ***P < 0.001 relative to untreated control or MMA cells. c Representative electron micrographs and quantification of cytoplasm area occupied by autophagy vacuoles (AV; expressed as the percentage of the total area); n = 43 control cells and n = 45 MMA cells pooled from two biologically independent experiments. Arrowheads indicate EM-compatible AV. d, e Immunoblotting and quantification of (d) phosphorylated and total forms of mTORC1 substrates and of (e) FIP200 and ATG13, n = 3 biologically independent experiments. f Representative inverted images and quantification of numbers of ATG13+ (top) or Ptd-Ins3P+ (middle) or WIPI2+ (bottom) structures per cell, respectively. Number of ATG13+ structures: n = 86 control cells and n = 118 MMA cells. Number of Ptd-Ins3P+ structures: n = 41 control cells and n = 141 MMA cells. Number of WIPI2+ structures: n = 71 control cells and n = 253 MMA cells. Values are pooled from three biologically independent experiments. Plots represent mean ± SEM. Two-tailed Student’s t-test, *P < 0.05, **P < 0.01, ***P < 0.001 and #P < 0.0001 relative to control cells in c–f. β-actin was used as a loading control in a, d and e. Scale bars are 10 μm in b and f, and 1 μm and 250 nm in c (left and right panels, respectively). NS non-significant. Source data are provided as a Source Data file.

