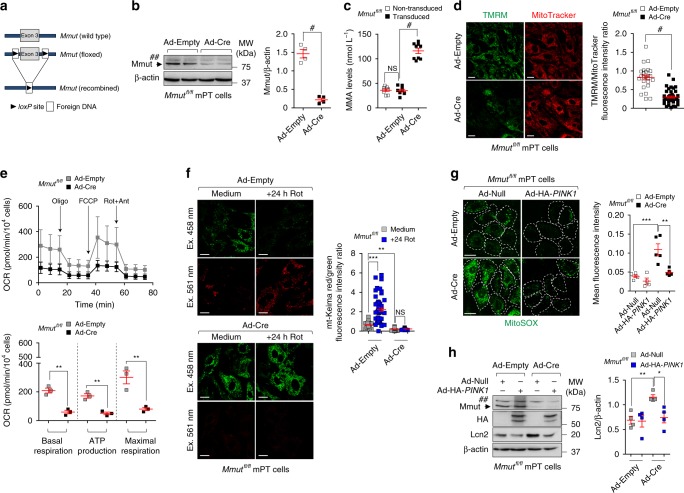
Fig. 7. MMUT deletion damages mitochondria and blunts PINK1-directed mitophagy triggering epithelial stress in kidney cells.
a–i Mouse proximal tubule (mPT) cells from floxed Mmut kidneys were transduced with adenovirus bearing Empty or Cre-recombinase for 5 days. a Workflow of strategy used to generate the floxed Mmut alleles. b, c Validation of Mmut deletion by b immunoblotting (n = 4 biologically independent experiments) and c by LC-MS/MS analysis of MMA levels (n = 9 replicates pooled from three biologically independent experiments). d Cells were loaded with TMRM (green) and MitoTracker (red). Confocal microscopy-based quantification of fluorescence intensity ratio in a cell. Number of cells transduced with Ad-Empty (n = 25) or Ad-Cre (n = 45). e Oxygen consumption rate (OCR) and individual parameters for basal respiration, ATP production and maximal respiration. OCRs were measured at baseline and after the sequential addition of Oligomycin (Oligo, 1 μM), FCCP (0.5 μM) and Rotenone (Rot, 1 μM) + Antimycin A (Ant, 1 μM). f Mmut cells were transduced with adenovirus expressing mitochondrially targeted form of Keima (mt-Keima) for 24 h and exposed to Rotenone (Rot, 5 μM for 24 h). Representative images and quantification of red/green fluorescence intensity ratio in a cell. Number of untreated (n = 68) and Rot-treated (n = 57) control cells, and number of untreated (n = 51) and Rot-treated (n = 58) Mmut-deleted cells. g, h Control and Mmut-deleted cells were transduced with adenovirus expressing Null or HA-PINK1 for 24 h. g Cells were loaded with MitoSOX (green) and analysed by confocal microscopy. Representative images and quantification of MitoSOX fluorescence intensity, n ≥ 4 randomly selected and non-overlapping fields of views per condition, with each containing ~10 cells. h Representative immunoblotting and quantification of Lcn2, n = 4 biologically independent experiments. β-actin was used as a loading control. Values in d–g are pooled from three biologically independent experiments. Plots represent mean ± SEM. Asterisks denote non-specific bands in b and h. Two-tailed Student’s t-test, *P < 0.05, **P < 0.01, ***P < 0.01 and #P < 0.0001 relative to control cells in b–e or relative to control or Mmut-deleted cells transduced with Ad-Null in h. One-way ANOVA followed by Bonferroni’s post hoc test, **P < 0.01 and ***P < 0.001 relative to untreated control cells or relative to control or Mmut-deleted cells transduced with Ad-Null in f and g. Scale bars,10 μm. NS non-significant. Source data are provided as a Source Data file.

