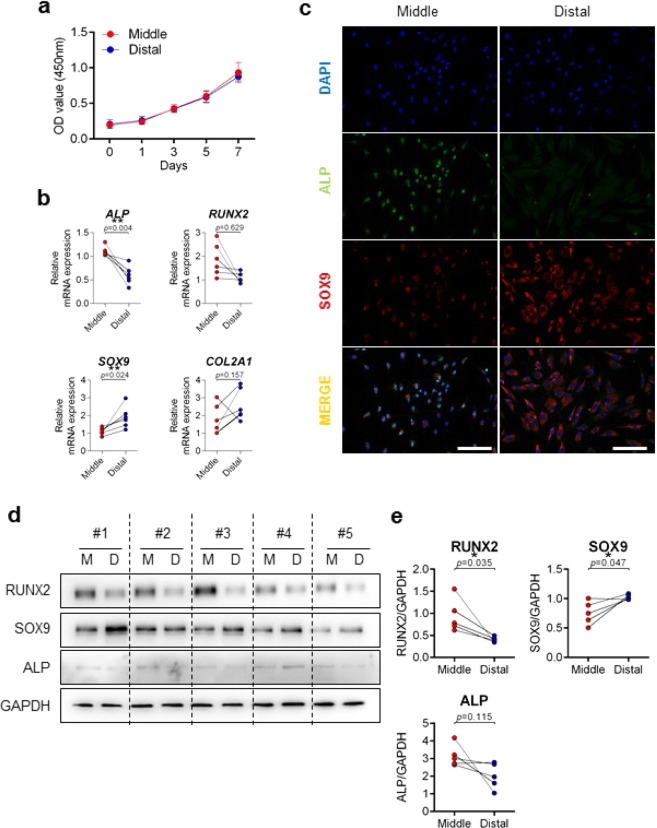
Figure 2.
Comparison of basal levels in cells derived from middle and distal third of ACLR regions. (a) Cell proliferation rates were determined using a WST assay. X axis: days; Y axis: OD value (450 nm). Red, Middle (n = 5); Blue, Distal (n = 5). (b) mRNA expressions of ALP, RUNX2, SOX9, and COL2 were compared by qRT-PCR. Red, Middle (n = 6); Blue, Distal (n = 6). (c) Expressions of ALP and SOX9 in both middle and distal cells were compared by immunofluorescence. Green, ALP-alexa-488; Red, SOX9-cy3; Blue, DAPI; Scale bar: 200 μm. Representative image data are shown (n = 3). (d) Expression of RUNX2, SOX9, ALP, and GAPDH were detected by immunoblotting (n = 5). (e) Quantification of (d). Red, Middle (n = 5); Blue, Distal (n = 5). Error bars show standard error of the mean. *p < 0.05. **p < 0.01.

