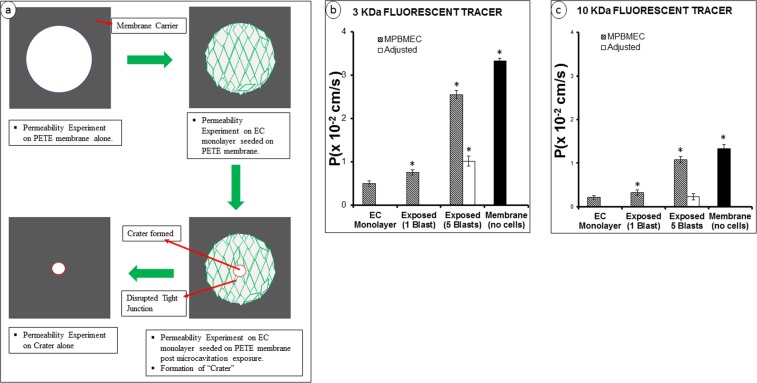
Figure 4.
Schematics of measurement of the permeability coefficient (P). (a) Experimental protocols summarized for the determination of Dextran permeability across in vitro BBE model. (b,c) Permeability coefficients measured using 3 or 10 kDa Dextran molecules. The adjusted permeability coefficients were determined according to the procedures shown in (a). This was necessary to delineate the permeability through the crater and through the tight junctions. The adjusted permeability coefficients reflect the altered biotransport properties through tight junctions. Data represent mean ± SD from 6 independent experiments. *Indicates p < 0.05 when compared to the control (i.e., EC monolayer).

