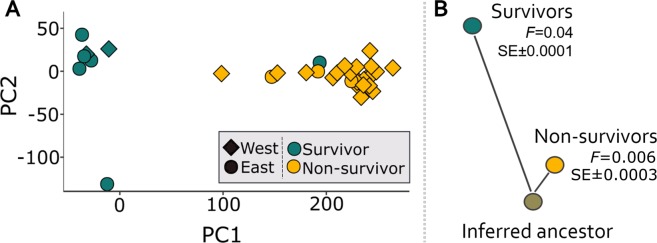
Figure 2.
Stochastic drift induced genetic change. (A) PCA of survivors of WNS, with non-survivors projected onto the PC axes; PC1 explained 27% and 66% of the variance among survivors and non-survivors, respectively, and PC2 explained 13% and 6% of the variance. (B) The estimated degree of genetic drift (F, as estimated in Structure36,37) is an order of magnitude greater for survivors compared to non-survivors, as illustrated by the contrasting branch lengths from an inferred common ancestor.

