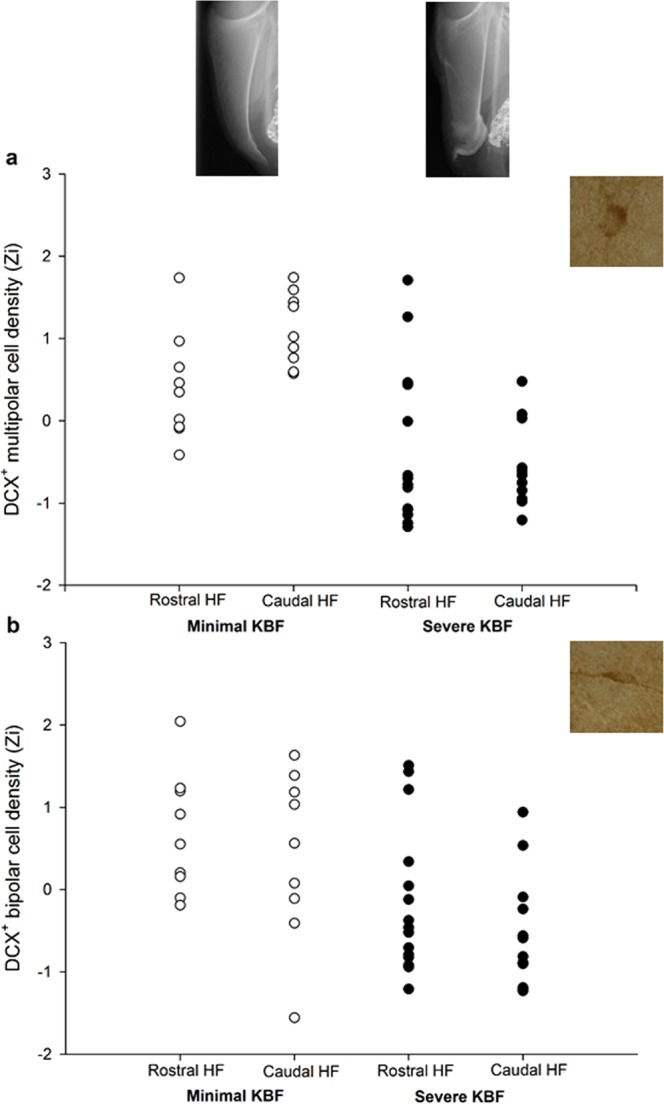
Figure 2.

Densities of (a) multipolar and (b) bipolar DCX-stained cells in the rostral and caudal HF subregions of hens with minimal versus severe keel bone fractures (KBFs) at time point 11, normalised (Zi) for staining batch. Example radiographs reflect the mean severity scores of the minimal and severe KBF groups: 3.5 and 8.5 respectively. Representative DCX+ stained cells of both morphologies are displayed at 100X magnification.
