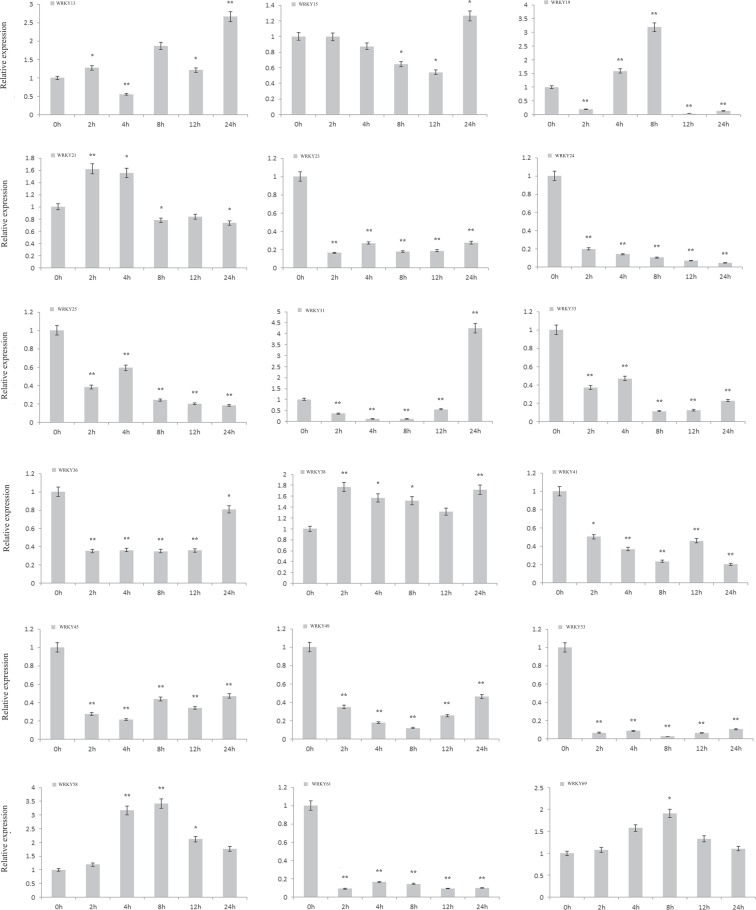
Figure 6.
Expression profile of AsWRKYs in MeJA treated calli. A. sinensis calli were transferred to MS containing 100 μM MeJA and sample at appointed times (0 h, 0.5 h, 2 h, 4 h, 6 h, 12 h, 24 h). Expression levels of all detected genes were assayed using real-time PCR analysis and AsGADPH as the internal control. Each value is the mean ± SE of 3 independent biological replicates. Asterisks indicate significant differences between each treatment point and controls (0-h time point) (*P < 0.05, **P < 0.01, Student’s t-tests).

