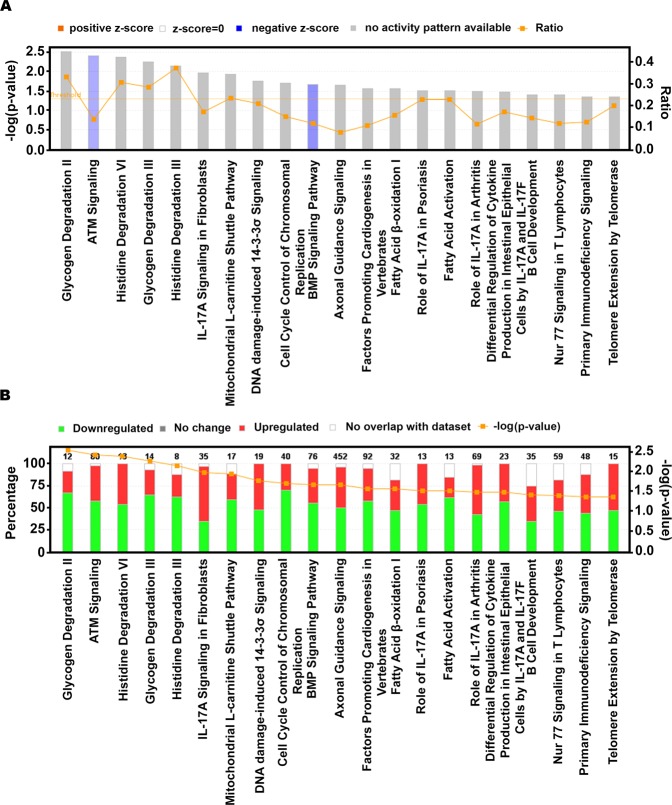
Figure 2.
Differentially regulated canonical pathways from Ingenuity Pathway Analysis. (A) The significance of each pathway (bar graphs; left y-axis), the log2 fold-change (line graph; right y-axis), and z-score/activity pattern (bar color). (B) Stacked bar chart depicting the percentage (bar graph; left y-axis) of pathway components up-, down-, or not differentially expressed (bar color), with the number of pathway components given over each respective bar, and the significance of the differential regulation (line graph; right y-axis). Only transcripts with q < 0.05 were entered in the analysis; all pathways depicted exhibit p < 0.05.

