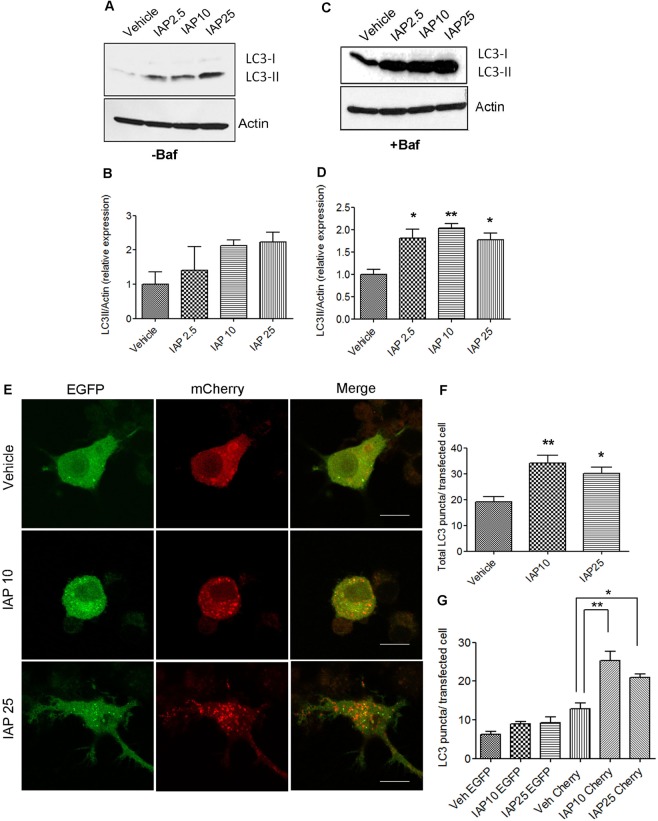
Figure 2.
IAP induces autophagy in RAW264.7 macrophage cells. (A) RAW cells were treated with 2.5, 5, or 10 U/ml of bovine IAP (A2356) for 24 hrs. Vehicle-treated cells were used as controls. Fifty µg of protein lysate was separated on SDS page and analyzed for LC3-II induction by Western blotting. Actin was used as a loading control. Blot represents a gel that was cut between 75 kDa (probed for actin ~37 kDa) and at 25 kDa (probed for LC3-I at ~16 and LC3-II at ~14 kDa) (B) Blots were quantified with ImageJ by analyzing the ratio of LC3-II/actin (mean ± SEM from three independent experiments). (C) Cells were treated same as in A, but in the presence of Baf (100 nM for 3 hours towards the end). Protein samples were probed for LC3. Blot represents a gel that was cut between 75 kDa (probed for actin ~37 kDa) and at 25 kDa (probed for LC3-I at ~16 and LC3-II at ~14 kDa) (D) Blots were quantified with ImageJ by analyzing the ratio of LC3-II/actin (mean ± SEM from three independent experiments). (E) Cells were transfected with mCherry-EGFP-LC3B expressing plasmid using nucleofactor V kit. After 24 hrs, cells were then treated with IAP for 24 hours and fixed with 4% paraformaldehyde. After washing with PBS, cells were mounted with permaflour mounting medium (ThermoFisher), observed, and imaged with the Olympus FluoView FV1200 confocal microscope. Scale bar = 10 µm. (F&G)Total number of LC3 puncta per transfected cell and mCherry+ EGFP+ (yellow) and mCherry+ EGFP− (red) puncta per transfected cell, representing autophagosomes and autolysosome respectively, were counted and plotted. One way ANOVA and Dunnett’s Multiple Comparison Test was used to determine statistical significance. *P < 0.05 and **P < 0.01, compared to vehicle.

