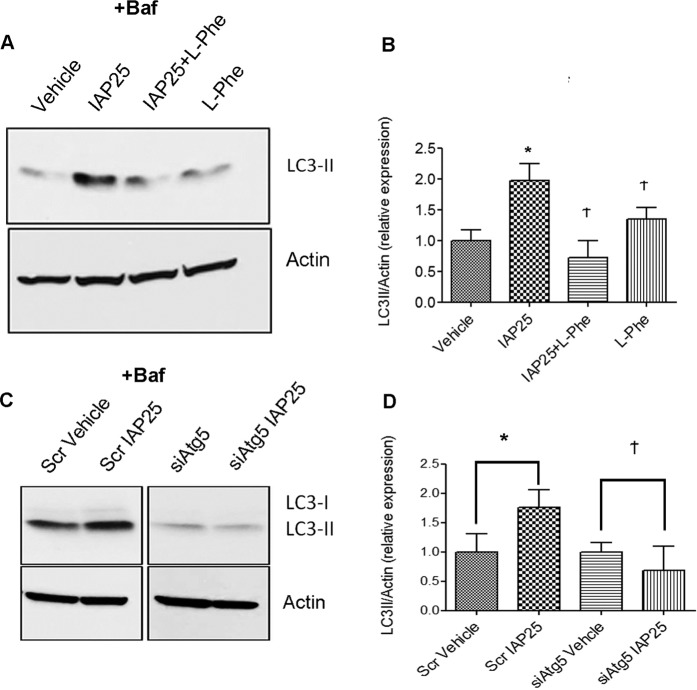
Figure 3.
IAP-induced autophagy is inhibited by L-Phe and by Atg5 knockdown. (A) RAW cells were treated with L-Phe (10 mM) or IAP alone or together for 24 hours and 100 nM Baf was added for 3 hrs towards the end. Fifty µg of protein samples were ran on SDS-PAGE and probed with LC3 and actin antibodies by Western blot. Blot represents a gel that was cut between 75 kDa (probed for actin ~37 kDa) and at 25 kDa (LC3-II at ~14 kDa) (B) Blots were quantified with ImageJ by analyzing the ratio of LC3-II/actin (mean ± SEM from three independent experiments). One way ANOVA and Dunnett’s Multiple Comparison Test was used to determine statistical significance. *P < 0.05 and Ϯ P > 0.05, compared to vehicle. (C) RAW cells were transfected with either Scr or siAtg5 siRNA for 48 hrs. Cells were then treated with either vehicle or IAP (25U/ml) for 24 hrs and Baf was added for 3 hrs towards the end of the experiment. Cells were harvested and protein samples were subjected to Western Blotting and probed for LC3 and Actin. Blot represents two gels that were cut between 75 kDa (probed for actin ~37 kDa) and at 25 kDa (LC3-I at ~16 kDa and LC3-II at ~14 kDa) (D) Quantification was carried out using ImageJ and data was plotted as LC3-II/Actin ratio (relative expression, arbitrary units). Students two-tailed T-test was used to compare significance between the vehicle and IAP treatment within a group. *P < 0.05 and Ϯ P > 0.05.

