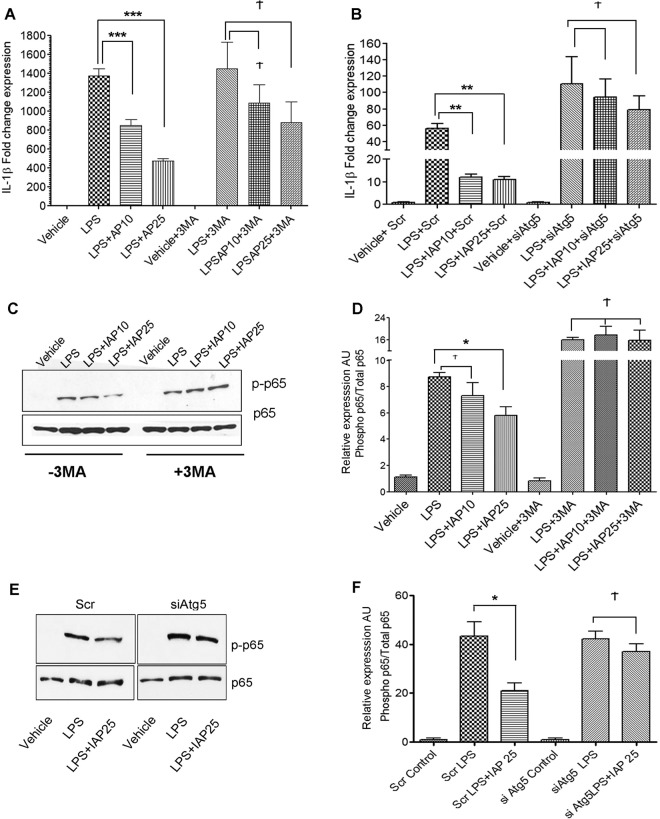
Figure 5.
IAP inhibits LPS-mediated proinflammatory effects in autophagy-dependent manner. (A) RAW cells were pretreated with or without 3MA (2 mM) for 1 hour before treatment with vehicle or bovine IAP (10 and 25 U/ml) for 24 hours followed by a challenge with LPS (25 ng/ml) for 24hrs. Cells were harvested, RNA was isolated and cDNA synthesized. qPCR was carried out to determine the gene expression of IL-1β with a 2ddCt method using 18 s as a housekeeping gene. Values were compared to the LPS treatment in the respective group. (B) Cells were transfected for 24 hrs with either scrambled siRNA or siRNA against Atg5 and treated with vehicle or IAP (A2356) at 10 or 25 U/ml for 24 hours followed by addition of LPS (25 ng/ml) for the next 24 hours. qPCR was carried out to determine the gene expression of IL-1β. Values were compared to the LPS treatment in the respective group (C) NF-κB activation was assessed by the phosphorylation of RelA/p65 subunit. Cells were treated with or without 3MA (2 mM) for 1 hr before adding IAP (A2356, 10 or 25 U/ml) for 24 hours followed by addition of LPS (25 ng/ml) for 15 mins. Cells were harvested and protein lysates were obtained. Western blotting was performed to detect phospho-p65. Total p65 was used as a loading control. Blot represents a gel that was cut between 100 kDa and 25 kDa probed for phospho p65 at ~65 kDa. The membrane was stripped and re-probed for total p65. (D) Graph represents mean ± SEM from three independent experiments). Values were compared to the LPS treatment in the respective group. (E) NF-κB activation was assessed in cells transfected with either scrambled siRNA or siRNA against Atg5 and treated with vehicle or IAP (A2356) at 25 U/ml for 24 hours followed by addition of LPS(25 ng/ml) for the 15 mins. Cells were harvested and protein lysates were obtained. Western blotting was performed to detect phospho-p65. Total p65 was used as a loading control. Blot represents a gel that was cut between 100 kDa and 25 kDa probed for phospho p65 at ~65 kDa. The membrane was stripped and re-probed for total p65. (F) Graph represents mean ± SEM from three independent experiments. Values were compared to the LPS treatment in the respective group. One way ANOVA and Dunnett’s Multiple Comparison Test was used to determine statistical significance. *P < 0.05, ***P < 0.001 and Ϯ > 0.05.

