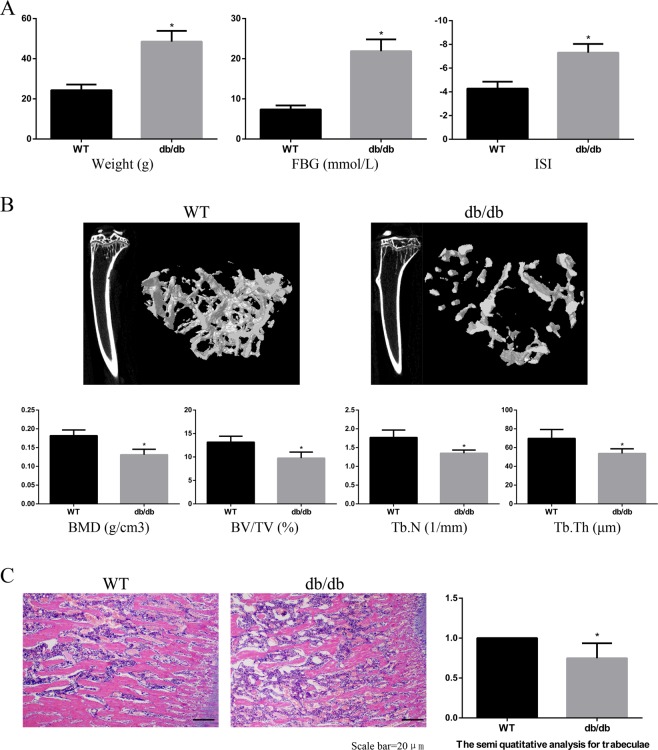
Figure 1.
Bone microstructure of type 2 diabetes osteoporosis mice. C57BKS db/db mice were included in the db/db group (n = 15), and their lean littermates C57BKS mice were included in the WT group (n = 15). (A) The body weight and FBG levels in the db/db group were significantly higher than those in the WT group at 12 weeks of age, while the ISI levels were consistently lower in the db/db group than in the WT group. (B) Micro-CT scanning at 12 weeks. The BMD, BV/TV, Tb.N and Tb. Th values in the db/db group were significantly lower than those in the WT group. (C) HE staining at 12 weeks. The number and thickness of trabecular bone were significantly lower in the db/db group than those in the WT group. HE staining data are expressed as the fold induction relative to the control. Values are presented as the mean ± SD. *P < 0.05 vs. WT, n = 15 per group.

