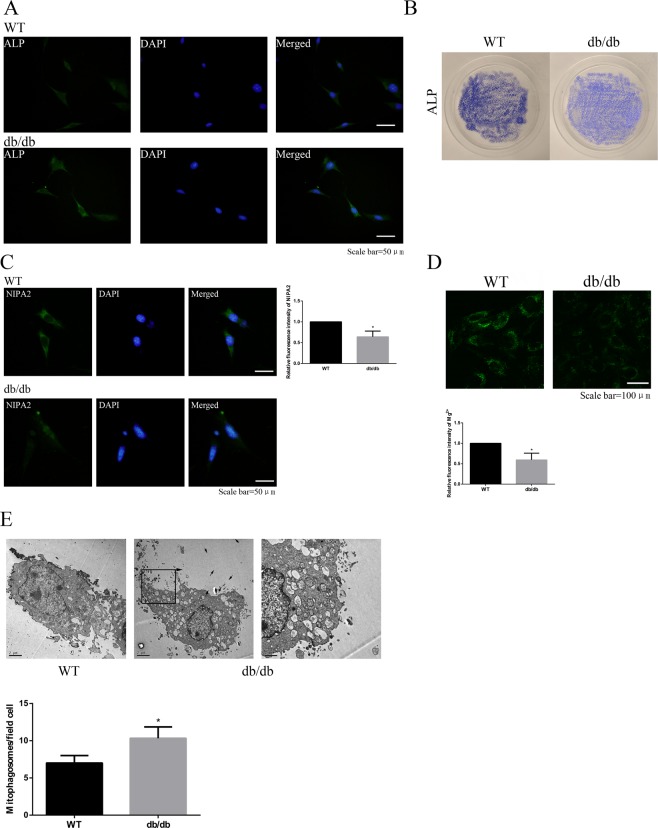
Figure 3.
NIPA2 expression and mitophagy in primary osteoblasts. (A) Immunofluorescence showing ALP expression in primary osteoblasts of each group. (B) ALP staining images of primary osteoblasts in WT and db/db groups. (C) Immunofluorescence of NIPA2 in primary osteoblasts of WT and db/db groups (values are presented as the mean ± SD; *P < 0.05 vs. WT, n = 30 cells from three independent experiments). (D) Detection of magnesium fluorescence in primary osteoblasts of WT and db/db groups (values are presented as the mean ± SD; *P < 0.05 vs. WT, n = 30 cells from three independent experiments). (E) TEM shows the number of mitophagosomes in primary osteoblasts of WT and db/db groups (scale bars, 1 μm and 2 μm. n = 3 per group. Values are presented as the mean ± SD *P < 0.05 vs. WT).

