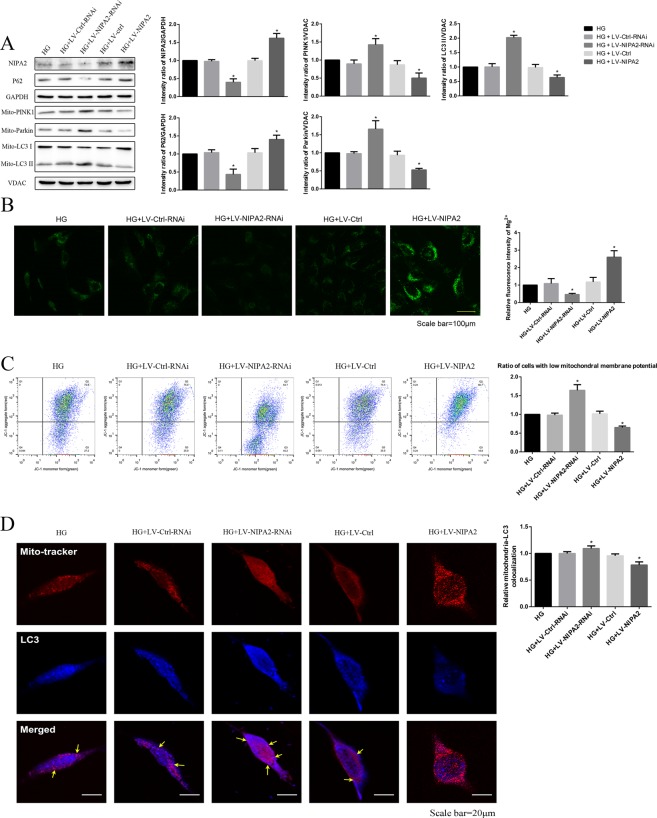
Figure 5.
Effects of NIPA2 on mitophagy. (A) Western blot showing the NIPA2, P62, mitochondrial PINK1, Parkin and LC3 protein levels in hFOB1.19 cells after transfection and HG treatment for 72 h. (B) Detection of Mg2+ fluorescence after successful NIPA2 transfection in HG at 72 h. (C) Flow cytometry showing the MMP of transfected hFOB1.19 cells after HG treatment for 72 h. Values are presented as the mean ± SD of three independent experiments. *P < 0.05 vs. HG. (D) Quantitative analysis of transfected hFOB1.19 cells treated with HG for 72 h that demonstrate colocalization of LC3 dots with mitochondria per cell (*P < 0.05, n = 9 cells from three independent experiments; Scale bar, 20 μm, values are presented as the mean ± SD). Data are expressed as the fold induction relative to HG.

