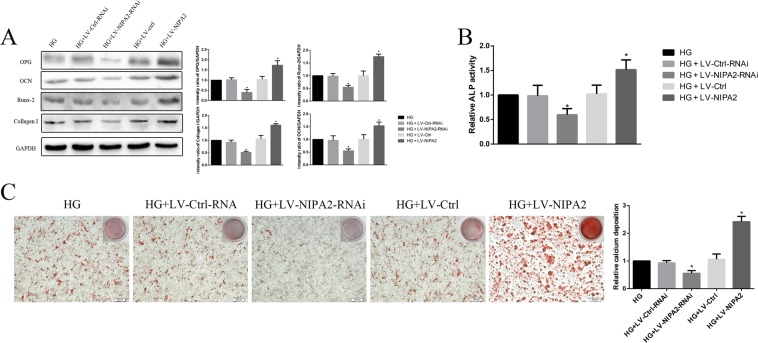
Figure 6.
Effects of NIPA2 on osteogenic capability. (A) Western blot showing OPG, OCN, Runx-2 and Collagen-I protein levels in transfected hFOB1.19 cells after HG treatment for 72 h. (B) Activity of ALP in transfected hFOB1.19 cells after HG treatment for 72 h. (C) Alizarin red S staining assay showing the mineralized extracellular matrix of transfected hFOB1.19 cells after osteogenic differentiation for 14 days. Values are presented as the mean ± SD of three independent experiments. *P < 0.05 vs. HG, #P < 0.05 vs. HG + LV-NIPA2. Data are expressed as the fold induction relative to HG.

