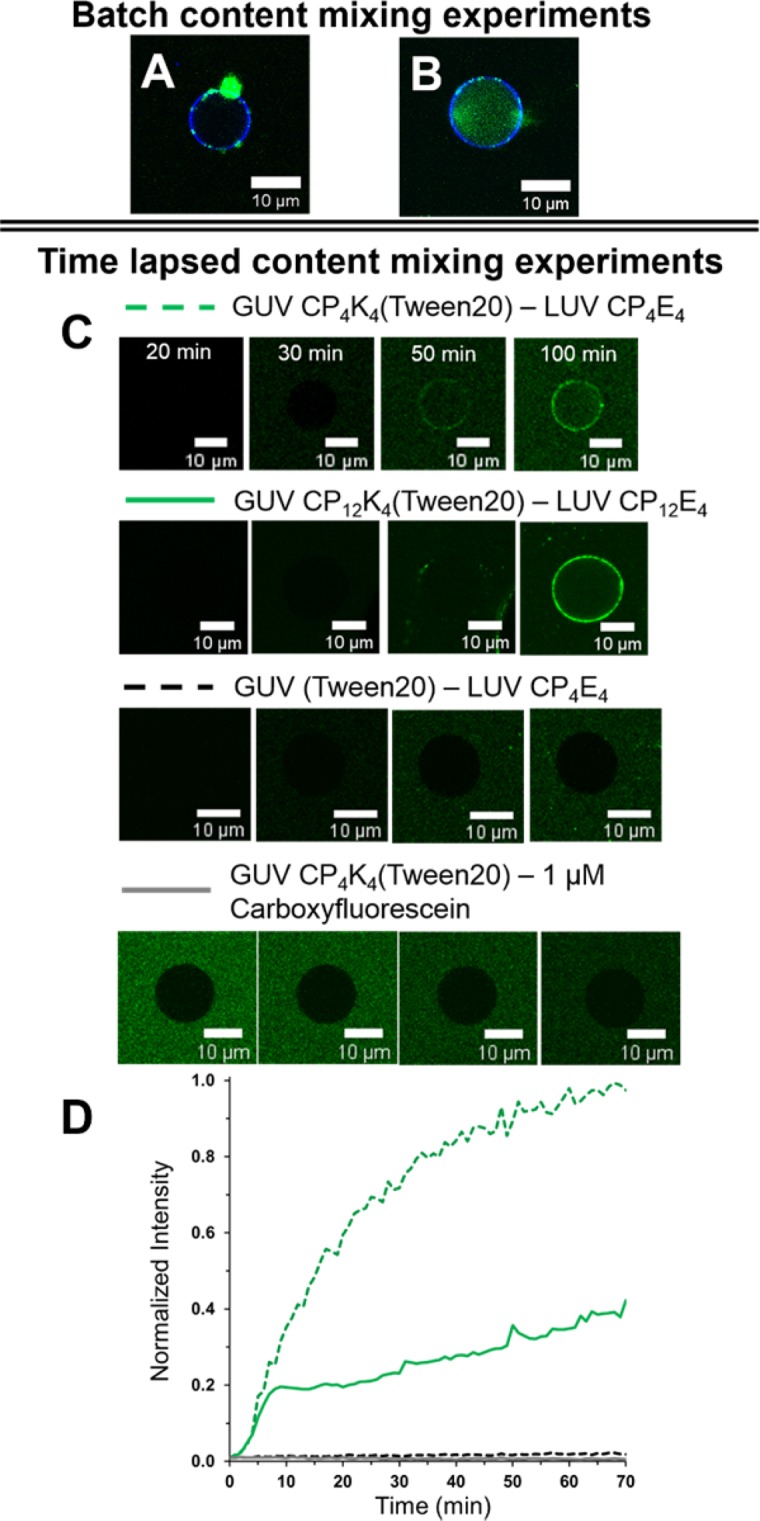
Figure 4.

Batch and time-lapse content-mixing experiments. (A) Batch content-mixing assay after one hour of incubation of CP4K4-functionalized GUVs and CP4E4-functionalized LUVs. The micrograph is the overlay of fluorescence confocal microscopy images for 488 nm (green) and 633 nm (blue) channels that shows a single GUV in blue without content mixing and clustering of liposomes in green. (B) Content-mixing assay after one hour of incubation of CP4K4-Tween 20 functionalized GUVs and CP4E4-functionalized LUVs. The micrograph shows a single GUV in blue with content mixing in green in the lumen of the GUV. Less clustering of LUVs is observed when Tween 20 is present. (C) Time-lapsed fluorescence microscopy images of selected single GUV undergoing content mixing with: GUV CP4K4-Tween 20 – LUV CP4E4, green dotted line; CP12K4-Tween 20 – LUV CP12E4, green solid line; GUV (Tween 20) – LUV CP4E4, black dotted line and GUV CP4K4-Tween 20 – 1 µM carboxyfluorescein, grey line. (D) Normalized fluorescence intensities over time in the lumen of single GUV from (C) Normalization profiles were calculated with the maximum fluorescence value obtained from the CP4K4-Tween 20 – LUV CP4E4 assay.
