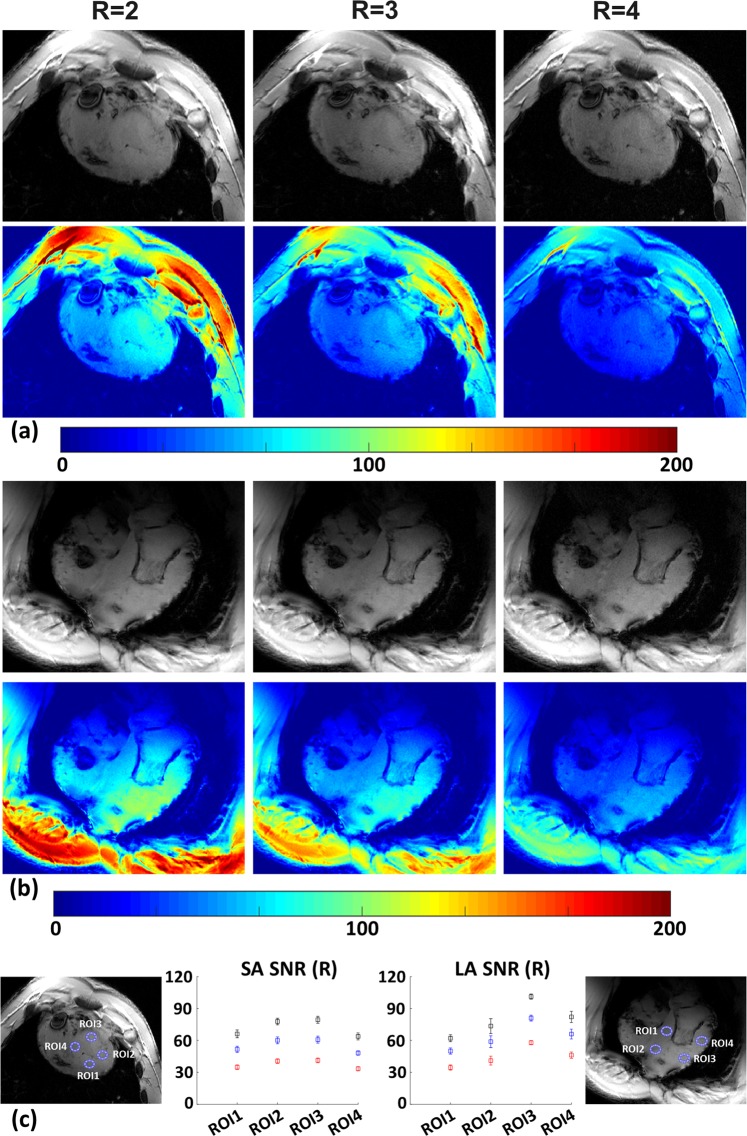
Figure 9.
Impact of parallel imaging acceleration on SNR in anatomical images within a cadaver pig #2 (46 kg). (a) Anatomical SA and corresponding SNR maps for varying acceleration factors R = 2, 3 and 4 (left to right). (b) Respective LA views analogous to (a). (c) SNR plots of mean ± single standard deviation in four myocardial ROIs for SA and LA views in dependence of the acceleration factor. Black: R = 2, Blue: R = 3, and Red: R = 4.

