Figure 2.
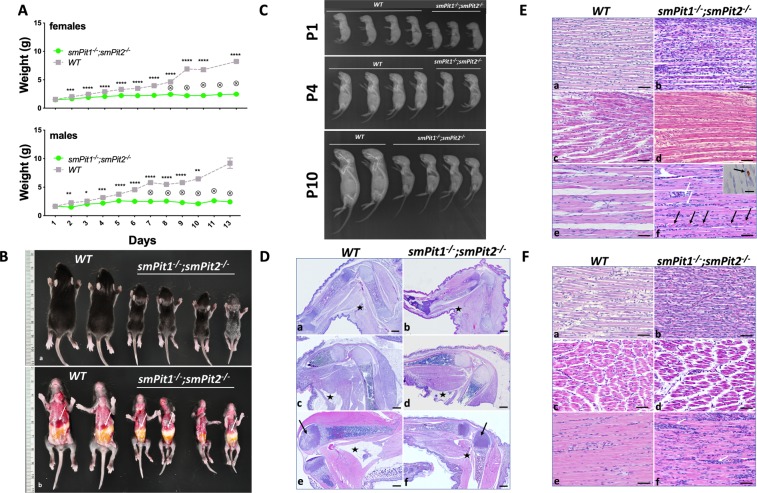
smPit1−/−; smPit2−/− mice die before two weeks of life due to starvation. (A) Growth retardation in smPit1−/−; smPit2−/− mice was evident by P2. No difference was observed attributable to presence of HSA-Cre, Pit1fl or Pit2fl (See also Fig. S6B). Means ± SEM, n = indicated, ****p < 0.00002, ***p = 0.0002, **p = 0.002, *p = 0.03 vs. WT. (B) Gross phenotype (P10) shows that smPit1−/−; smPit2−/− mice were much smaller but retain normal proportions, their stomachs were variably filled with milk, and their livers were atrophic (white arrow). (C) Radiographs, at P1, P4 and P10. Smaller size was evident in smPit1−/−; smPit2−/− mice at P1, with reduced growth rate evident by P4, and markedly so by P10. Generalized retardation of mineralization of both axial and appendicular skeleton was noted in mutant animals. smPit1−/−; smPit2−/− mice were proportionately comparable to WT littermates, indicating generalized delay in growth. (D) Hind limb bone, muscle and fat development at P1, P4 and P10. a, c, e: WT; b, d, f: smPit1−/−; smPit2−/−. At P1, smPit1−/−; smPit2−/− mice were slightly smaller (b), and both genotypes had comparable minimal fat stores (asterisk, popliteal subcutaneous fat pad). At P4 and P10, smPit1−/−; smPit2−/− mice exhibited generalized delayed growth, with reduced accumulation of skeletal muscle mass. Delayed ossification of the distal femoral epiphysis at P10 is indicated (black arrows, e, f). Subcutaneous white adipose tissue accumulated in both genotypes through P4, however by P10, this is almost entirely lost in smPit1−/−; smPit2−/− mice (asterisk, popliteal subcutaneous fat pad, c-f). H&E, bar = 500 µm. (E) Muscle phenotype, anterior tibialis muscle, at P1, P4 and P10. a, b: P1. Compared to WT (a), myofibers in smPit1−/−; smPit2−/− mice (b) were poorly organized, thinner, and display indistinct and irregularly distributed myofiber nuclei with increased overall cellularity. c, d: P4. Myofibers in smPit1−/−; smPit2−/− mice (d) were slightly thinner than in WT (c) and had less robust but structurally comparable sarcomeric striation by light microscopy. e, f: P10. Compared to WT (e), myofibers in smPit1−/−; smPit2−/− mice (f) were thinner, with abundant interstitial cellularity (white arrows), and frank myofiber disintegration (black arrows). Sarcomeric striation was retained but was less robust. Cleaved caspase-3 cytoplasmic immunostaining was noted in mutant muscle (inset). H&E, bar = 50 µm (a–f), 20 µm (Inset, f) (F) Muscle phenotype, quadriceps femoris muscle, at P1, P4 and P10. a, b: P1. Compared to WT (a), myofibers in the mutant (b) were thinner with increased overall cellularity. c, d: P4. Myofibers in smPit1−/−; smPit2−/− mice (d) were thinner than in WT (c), with less evident sarcomeric striation by light microscopy. Interstitial regions are expanded in mutant muscle. e, f: P10. Compared to WT (e), myofibers in smPit1−/−; smPit2−/− mice (f) were thinner, with scattered aggregates of increased interstitial cellularity (white arrows). H&E, bar = 50 µm.

