Fig. 3.

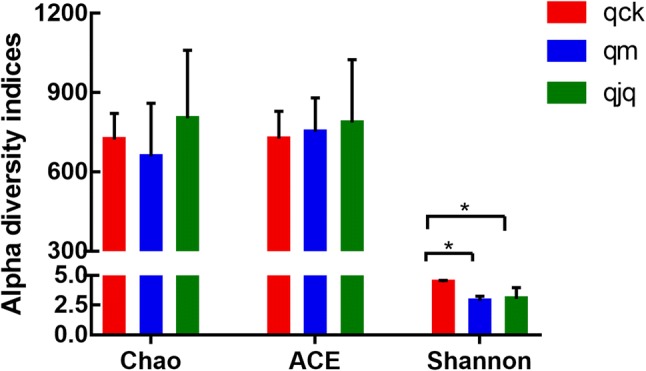
Alpha diversity analysis of the gut microbiota in different groups based on the Chao, ACE, and Shannon indices. qck, healthy group; qm, AAD group; qjq, QCD treatment group. Data are the mean ± SE, n = 3. *p < 0.05 vs. the healthy group

Alpha diversity analysis of the gut microbiota in different groups based on the Chao, ACE, and Shannon indices. qck, healthy group; qm, AAD group; qjq, QCD treatment group. Data are the mean ± SE, n = 3. *p < 0.05 vs. the healthy group