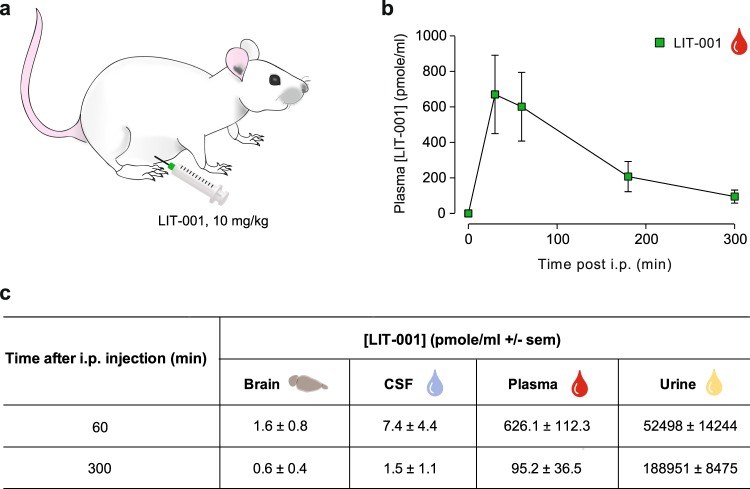
Figure 5.
LIT-001 distribution and clearance in the organism. (a) Scheme displaying the i.p. injection of LIT-001, 10 mg/kg in naïve animal. (b) Time course of the concentrations of LIT-001 present in the plasma of rats after an i.p. injection. (c) Concentrations of LIT-001 present at 60 and 300 min after i.p. injection, in the brain (60, n = 6; 300, n = 5), CSF (60, n = 4; 300, n = 4), plasma (60, n = 11; 300, n = 5) and urine (60, n = 6; 300, n = 5) 60 min and 300 min after i.p. injection. Data are expressed as mean ± SEM. Data are expressed as mean ± SEM of 5 animals.

